Visualized by :
PappasGroup.com
Published by :
Tags
Related Posts :
ADVERTISEMENT
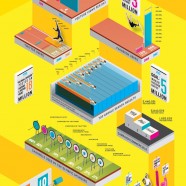
Brands social performance in olympics
A nifty infographic perfectly adapted to the olympic sports spirit that shows the preformance and records of popular brands’ social media marketing activity compared with the ones 4 years back.

Digital Marketing Consultant at Click Factor
Commited to help small and medium business owners to walk their success path online.
Latest posts by Stavros Zakkas (see all)
- 5 Tips to Supercharge Your Social Media Marketing Engagement - January 28, 2017
- Valentine Day Confidential - February 12, 2014
- Big Data in 2014 - February 11, 2014


MOST COMMENTED