
Learn more about the level of fanaticism shown by the fans of each football team in the UK. This infographic will tell you all.
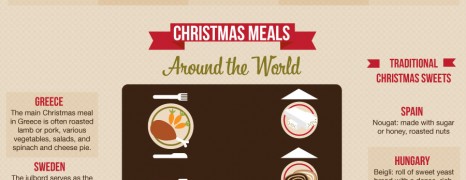
Christmas Traditions Around the World
visualized by: christianuniversitiesonline.org
Learn about the etiquette and traditions of the Christmas season that people from around the world love to keep up. Read about outstanding Christmas habits from Sweden, Venezuela, UK, Japan, Finland, Spain and many more.
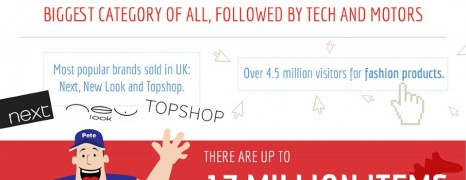
Britons Love eBay
visualized by: iPost Parcels
Keep calm and eBay on. This infographic gives us a picture of the never ending love affair of Britons with the robust online market place.
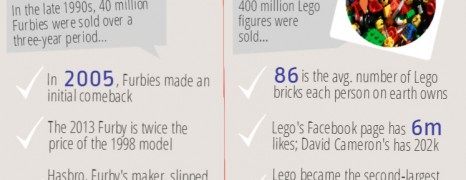
Top Toys UK 2013
visualized by: iPost Parcels
The numbers are in! One thing that’s always in demand at every Christmas holidays is toys! 2013 has been no different. This presentation looks into what captures most kids interest this year in the toy department.
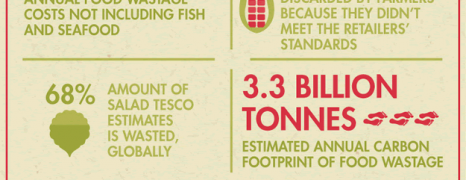
Food Wastage in UK
visualized by: Neo Mammalian Studios
British consumers leave tonnes of food on their plates every year. Food wastage has evolved to a critical issue for developed countries like UK and a paradox for countries where people are below the breadline and are starving to death. What can we do to change this?

White Lies Parents Say
visualized by: Neo Mammalian Studios
Depending on the country you grew up in, you have probably heard some of these little white lies from your parents’ mouths.
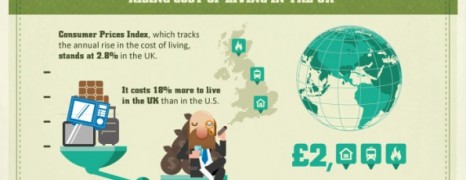
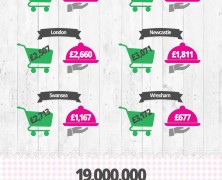
Cost of Living in UK 2013
visualized by: Neo Mammalian Studios
Get a picture of wealth distribution among UK residents and the impact of inflation on the purchase power of 1 million pounds and real estate market over the last 20 years.
UK Dining Trends
visualized by: restaurantchoice.co.uk
Have you ever wondered how much Britons spend weekly on dining out and takeaway ? Likely more than you think! RestaurantChoice.co.uk give us a rundown on what the UK spends on food each week. Why not have a look and see if you match up with the rest of the nation.
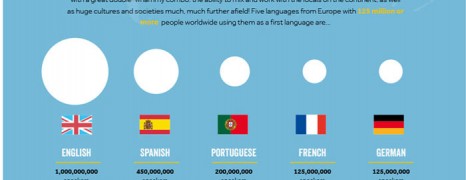
Second Language Benefits
visualized by: Rosetta Stone, UK
With 1 billion speakers, English is beyond any doubt the 1st option for language learning for non native speakers. However, speaking a second language is a big plus both for professional and general communication use. This report highlights 2nd language deficiency among Britons.
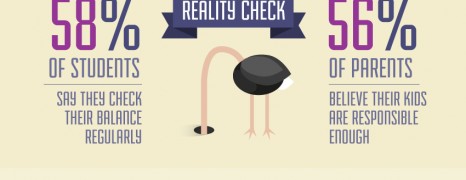
Student Spending Habits UK
visualized by: Natwest
An insight into what students say they spend a month compared to what their parents say they think their children spend per month
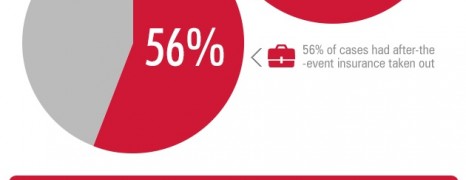
Litigation Funding in UK
visualized by: Neo Mammalian Studios
Are you a solicitor or a litigant? Or maybe you’re just curious about the changes made to the British litigation field. It doesn’t matter because we have information for you.
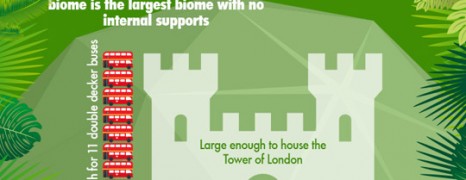
Biggest Conservatory in the World
visualized by: Stormclad
It’s a matter of size and scale. Britons have built the biggest conservatory in the world and they have been featured in the Guinness World Records for this feat. This graphic give us an idea of what it takes to make a tropical ecosystem under the British clouds.

Corporate Tax Evasion UK
visualized by: Render Positive
This report brings up for discussion the corporate tax evasion case in the UK as a major issue for the British economy. Three of the world’s giants are put under the microscope. Guess which.
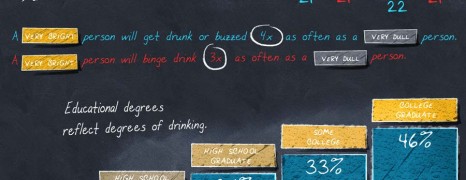
IQ and Alcohol Consumption
visualized by: BestMastersDegrees
According to a number of studies childhood intelligence and alcohol consumption inclination during adulthood are directly correlated .
The findings indicate that it is intelligence itself that influences alcohol consumption, not all the things that accompany intelligence.
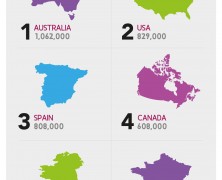
British Emigrants
visualized by: jellyfishbrighton.co.uk
Britons are leaving home in search of a brighter country or of new opportunities abroad. 198,000 is the number of Britons emigrates in 2012 while Australia is traditionally the most popular destination they choose to put down roots. See more facts for British emigrants.
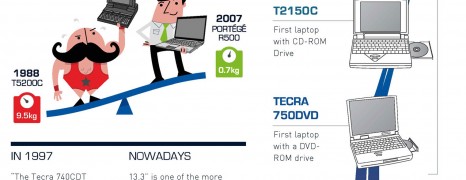
Toshiba Laptops Milestone
visualized by: Toshiba
Toshiba celebrates 10 million sold laptops milestone with this retrospective presentation of the fascinating changes over them and shows some nice and sparkly information on how many laptops 10 million really is!! Comparisons show clearly the progress that has been made as far specs and design in portable computing.

Bacon for the People
visualized by: Wren Kitchens UK
In the wake of the “International Bacon Day” (that was August 31) guys from Wren Kitchens UK, compiled this infographic and provide all we need to know about bacon! From its first existence to some weird and wonderful bacon creations. Click and bite the crispy!
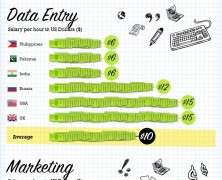
Online Jobs Salary
visualized by: Staff.com
Based on oDesk ‘s aggregated data for online jobs’ salary demand, this report from Staff.com gives the whole picture of how labor hour for distance working is valued around the world. 4 of the most popular fields are examined including Web Development, Data Entry, Marketing and Mobile App development.

Men vs Women Driving
visualized by: vogmedia.com
This motion infographic with a pretty uplifting tune in the background, addresses the agelong wrangle between men and women drivers. Have you ever concluded which of the both sexes performs better in driving? Brit men and women are contesting for the first place based on 3 typical criteria. Follow the link to see the static version if you like.
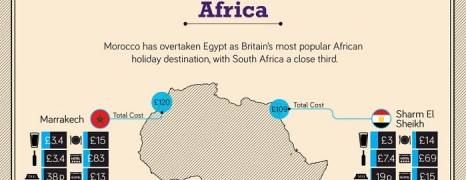
Pound Value Around the World
visualized by: Neo Mammalian Studios
The title is tricky. Actually it’s not about a financial report but rather a mapping of pound value across various popular holiday destinations for British tourists based on common holiday expenses. Britons now know where they get more for less!