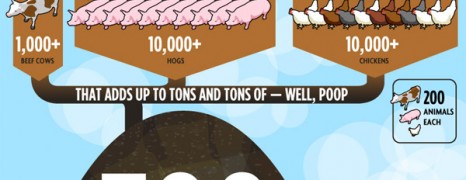
Overconsumption of meat by humans during the last decades has led to the development of large scale animal farming plants for the sake of massive animal food production. But overdoing with nature sooner or later ends up with detrimental effects on earth’s ecosystem.
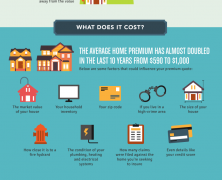
Home Insurance 101
visualized by: Lending Expert Blog
This infographic presents some interesting stats and facts about home insurance industry and serves as a basic guide for homeowners who need some help in choosing insurance plan and company and want to avoid involved pitfalls.

Waning US Education
visualized by: nowsourcing.com
According to the figures presented here, literacy rates across the US are not of the most promising and the inefficiency of education system to adopt a more flexible approach to teaching methods is largely pointed out.
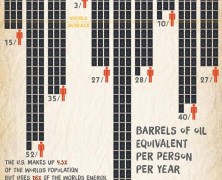
Eco Footprint 2013
visualized by: EricPhillips.net
Humans are consuming the resources of 1,5 Earths to satisfy their needs and support their lifestyle. Have a look at how we exhaust natural resources while generating thousands of tones of waste.

Worldwide Drone Usage
visualized by: HotButterStudio.com
Watch out! A drone might come on you. Drone usage both for military and governmental purposes has surged over the last years. Americans, as expected, are the pioneers in unmanned military vehicles, but several countries are following and projections are that drone spending will double within the next decade.

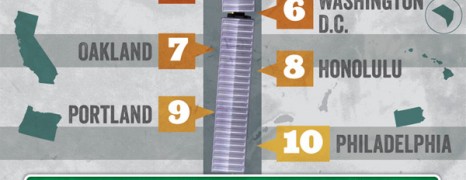
Happiest Cities in America 2013
visualized by: Jetpac
Guys from Jetpac City Guides collected and processed over 100,000,000 photos posted on Instagram and taken from various spots across America, in an effort to address the happiest city and build US cities smile index. Cast a smile before start reading.
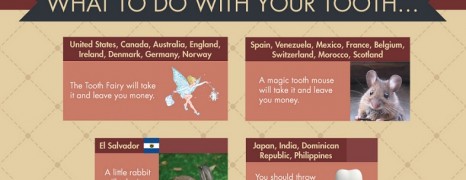
White Lies Parents Say
visualized by: Neo Mammalian Studios
Depending on the country you grew up in, you have probably heard some of these little white lies from your parents’ mouths.
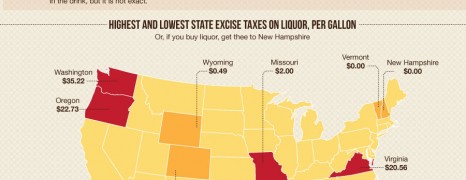
Excise Tax in US History
visualized by: Accounting School Guide
Do you have any idea of how much we shell out on taxes for pleasure products like alcohol, cigarettes, gambling and marijuana? Let’s see how much we would save from tax excise if government was less greedy with our pocket and learn from the the tax history in the US.
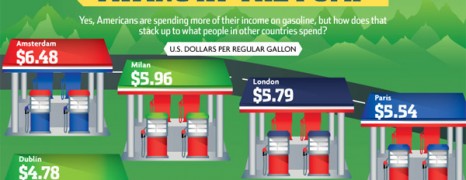
Gasoline Consumption in the US
visualized by: Finance Degree Center
Americans still belong to the gasoline ravenous of the world with an average spending of $3000 for 2012. See a breakdown of gasoline consumption and fuel industry profits in and outside the US.
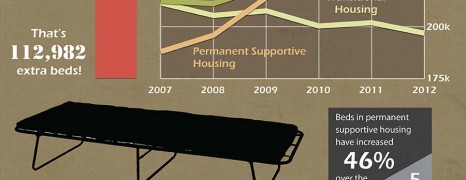
Homeless in the US 2012
visualized by: KingWorks Creative
Exhaustive data about homelessness : states accounting for nearly half the homeless population, states having the highest rates of unsheltered homeless and more!

Healthcare.gov not Working
visualized by: Healthcare Administration Degree
More than one month after Healthcare.gov was launched, trouble has plagued the website. The high volume of visitors exposed many of the website’s capacity and software weaknesses. The following infographic quantifies the shortcomings and glitches that caused the thumb down of the public.

Small Business Marketing Spending
visualized by: GreenFlagDigital.com
With a recovering economy, small business owners have to show as much wisdom as they can when creating their marketing plan and deciding on the total spending budget for the New Year. Marketing budget consists a common woe for small businesses. Let’s see some trends.
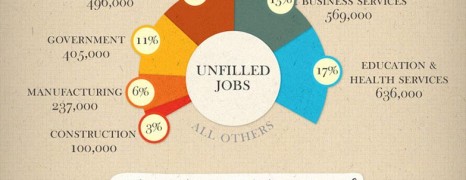
Skilled Worker Demand
visualized by: HowtoBecomeA.net
Even more industries are jacking their hiring standards and require skilled workers with postsecondary education in the US. But the gap of unskilled labor force is now more evident than ever and projections are that it’s going to keep growing leaving a notable percentage of job demand uncovered.
Aggressive Driving Statistics
visualized by: BestAccountingDegrees.net
Getting uncontrollably aggressive, starting to cuss and coarse is quite common for most of us while driving. Behold! Road rage can turn to blight.
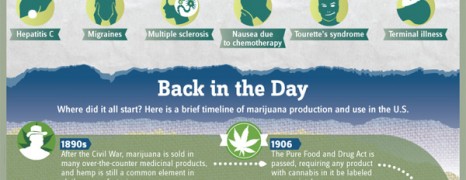
History of Marijuana Use in the US
visualized by: Online Paralegal Programs
Decriminalization of marijuana use in the US has been an age-long dispute for the state and national societies. This infographic presents the history of marijuana production and use and highlights the benefits of medical marijuana as a supportive treatment for a range of diseases.
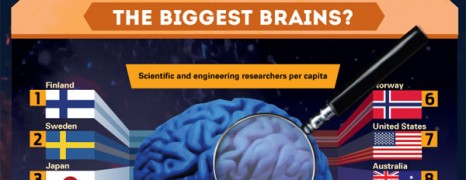
Scientific Research Spending by Country
visualized by: Super Scholar
This report with impressive illustrations presents a breakdown of the scientific research and development spending around the world and raises questions regarding the ROI of investing in brain.
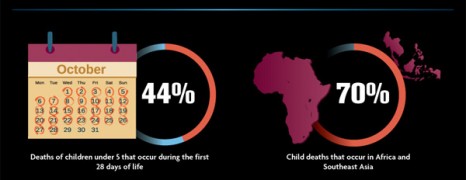
Global Infant Mortality Rate Facts
visualized by: Social Work Degree Center
It’s distressing to see new life perishing due to inadequate or ineffective health system. This graphic presents the naked truth about infant mortality worldwide.
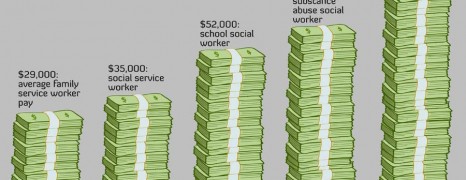
Social Workers Wanted
visualized by: Social Work Degree Center
This infographic rises awareness about the growing leadership gap and the need for new professionals willing to work as social workers. If it happens to find yourself in empathy and solidarity, you may discover some opportunities and options here.
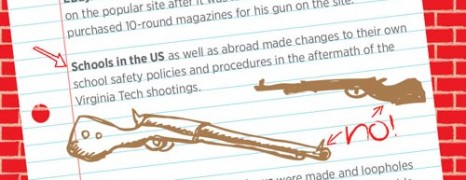
School Security USA
visualized by: Security Degree Hub
Have a look at some devastating facts regarding school safety and security in the US and how certain armed attacks have urged the enforcement of proactive measures against school violence .
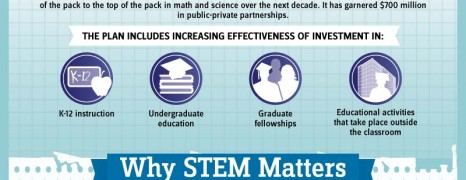
STEM Education USA
visualized by: Top Education Degrees
STEM stands for Science, Technology, Engineering and Mathematics and these 4 knowledge fields are the high hanging fruits for the education system in USA. According to this report native American labor falls far behind foreign job seekers in STEM skills. See what the improvement scheme involves.