
Google Nexus 5 is out. Let’s see how the Nexus project has evolved to the top-notch smartphone handset of today.
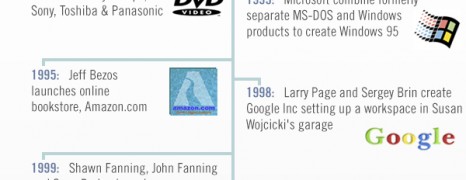
25 Years of Technology
visualized by: Insight UK
Technology runs faster than our eyes and it’s hard to pack 25 years of evolution in a “small box”. Guys from Insight UK with the opportunity of their 25th anniversary, handpicked 23 of the most striking milestones in tech history since 1988.

Corporate Tax Evasion UK
visualized by: Render Positive
This report brings up for discussion the corporate tax evasion case in the UK as a major issue for the British economy. Three of the world’s giants are put under the microscope. Guess which.

Google Money Machine
visualized by: bestaccountingschools.net
Discover how the web giant has evolved to global tech mentor with a variety of verticals and projects where from pumps billions of bucks.
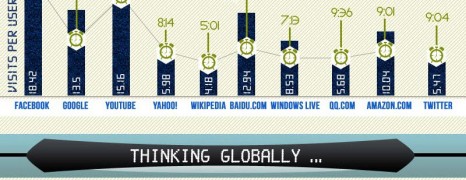
Global Online Time Spent
visualized by: Top Computer Science Degrees
See a breakdown of the most popular web properties around the world and users’ habits regarding visit frequency.

Wearable Technology
visualized by: GreatBusinessSchools.org
Google Glasses consists of the most conspicuous projects of advanced wearable technology that will be available for civilian use by the end of 2013. Together with the undercover iWatch project from Apple and several other innovative, yet still in labs ideas, these are signs of a totally new approach in the way humans will utilize technology in the future. Is that going to be easy for the average user?

Driverless Cars Coming
visualized by: Neo Mammalian Studios
It’s not utopia, not even a dream. It’s true expectation. Hands off the wheel! 3 robust car manufacturers and a web empire run the most promising projects of driverless car technology. One of them precedes but the race is still on. Who’s going to come first?
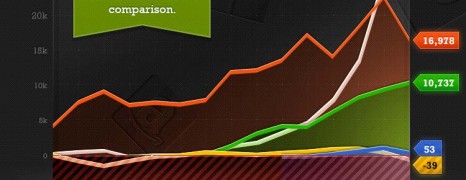
Tech Companies Profits 2012
visualized by: Staff.com
Five of the most popular tech giants (Apple, Microsoft, Amazon, Google, Facebook) are contesting in a dollar runrace. See how they have performed historically till 2012 as for revenue, profit and market caps.
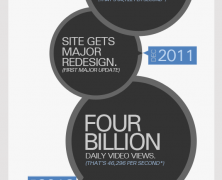
Youtube Chronicle
visualized by: ShortyMedia
From 2005 when it was founded and launched till now YouTube has managed to evolve to a video sharing titan that has gained millions of regular users and billions of daily views. YouTube has overtaken even popular search engines such as Bing and Yahoo. See the highlights of its history.
Living with Google
visualized by: MapsofWorld.com
Could you stand a life without Google? Obviously the intertnet giant has slipped into various aspects of our online activity with its numerous verticals. Some voices allege that the Google empire debilitates our mental abilities. Read the reasoning and the opposings.

Google Verticals and SEO
visualized by: imFORZA.com
After 2 years of investigation over search result manipuation allegations about Google Verticals (e.g. Google Books, Google Shopping, Google News etc.) Google managed to get off the hook. But how much should actually online marketers count on SEO and what are their options for Google’s verticals optimization?

The Online Population Boom
visualized by: Doctor Who?
Internet users have been increased by 528% since 2000. A whole new world with evolving digital habits is ready for action.

The Patent Wars
visualized by: Visual.ly
And the battle begins! See here a really complicated diagram of the backstage relations among the top tech companies.

Google: Behind The Numbers
visualized by: busiinessmba.org
Google the Queen of the chessboard. Google’s revenue outnumber the GDP total of the 28 poorest countries. Here are the magic numbers.

Google Penguin: A Lesson It Teaches
visualized by: Geno Thampi
Do you think that Google Penguin is a brand new idea? There are clues that this recent algorithm release has its roots back in 2003 and the Cassandra update.
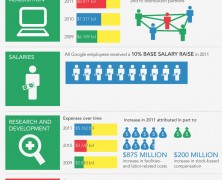
Google Finance
visualized by: Masters in Finance
A sneak peek at the revenues, costs, expenses and profit of the Google empire. Offering free products while extending expenses doesn’t necessarily means you end up with red ink.
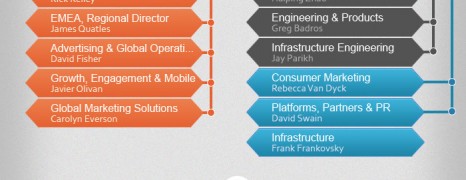
Facebook and Google Structure
visualized by: Graphs.net
Meet the white collars of the two internet giants. A graphical representation of Facebook and Google company hierachy structure depicting the the roles, departments and relations.

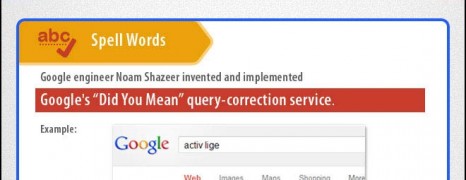
Where is Google Making Its Money
visualized by: nowsourcing.com
Are you wondering what feeds the Google empire? With a top term query click value over 50$ it’s easy to reach the sky.
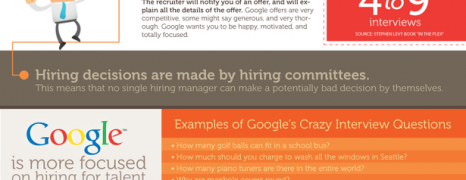
What Does It Take To Get A Job At Google
visualized by: Jobvine
It takes 9 steps to go through the Google recruit filter and get the job you’re dreaming. Know your before apllying.
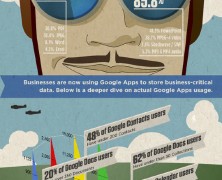
Intelligence On Goog...
visualized by: Heinley
Cloud computing is a tunring point of the digital era. Could you estimate the volume of information stored online?