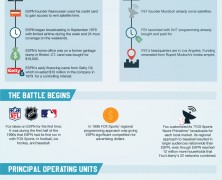
Sport fans would love to see this illustration with historical highlights and operational background of the two major cable sport networks FS1 and ESPN.

Xbox one vs PS4 Games
visualized by: ScholarAdvisor.com
Guys from Scholar Advisor venture a comparison between the two game console giants based on popular game titles for several categories including racing, horror, shooting, survival.

10 Best Butlers
visualized by: Neo Mammalian Studios
A virtual contest among 10 popular butlers from famous films and tv shows. See who is the best butler of all times.

Firework Safety Tips
visualized by: RedStar Creative UK
Fireworks at home can be great fun as long as they are used safely and handled properly. Clearly out of the infographic ideation but it serves good for our safety during festivity times.

Locations of Game of Thrones
visualized by: Neo Mammalian Studios
With the advanced technologies utilized in film making, it’s no surprise to think that most of the magic and spectacular Game of Thrones scenes are imaginary. Contrary to what expected, they are true locations anyone can visit. Discover the kingdoms on the map.
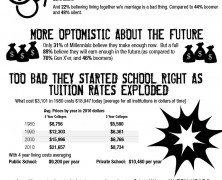
Unlucky Millennials
visualized by: Non-profit Colleges Online
Likely the fist colorless infographic featured on IGM. It presents and compares the typical traits and attitude of the various generations with a special focus on Millennials’ reality. It seems that though Millennials is a generation nurtured for “more”, it finally gets “less”.
The generation with the highest joblessness and debt out of school remains optimistic, though the punches keep on coming.
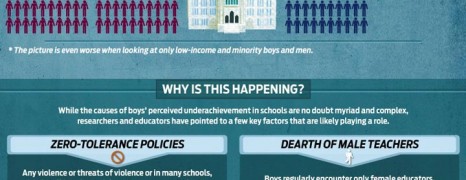
Boys vs Girls Learning Differences
visualized by: Top Masters in Education
Facts show that girls take precedence over boys in terms of educational achievements even from the early days of schooling. Among the numerous underlying factors, experts point out 4 major causes for boys’ learning incompetence and suggest methods that can keep boys on the rail.
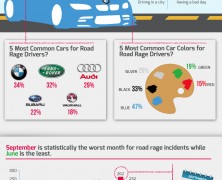
Angry Drivers
visualized by: SafetyVideos.com
This infographic profiles the angry drivers cohort, that is usually more aggressive and intolerant against traffic offences perpetrated by their peers and tend to be a bit more expressive of their anger.
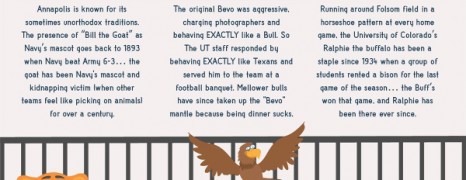
American College Football Traditions
visualized by: EquipSupply
From the 8 clap sequence cheer at UCLA games to the tailgating etiquette, this is all about traditions and rituals of college football games Americans love to keep up.
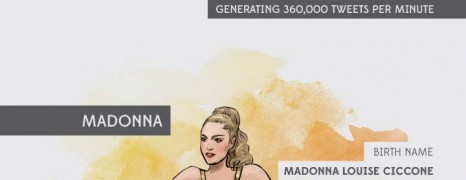
Weird Celebrity Clothes
visualized by: Neo Mammalian Studios
The world of music is also made of controversy, especially when fashion decides to meddle. See 8 of the most swanky clothing selections of renowned female celebrities.

Medical Debt in the US
visualized by: National Debt Relief
Unpaid medical bills are now the leading reason Ameircan households are scrambling. What’s the cause of medical debt inflation?

Gardening is Good
visualized by: Doctor Who?
You know that “green” is good. But how much good does green-making return? Benefits from gardening range from personal to communal.

Kill Time at Airport
visualized by: Neo Mammalian Studios
Either it’s about half an hour or even more, sitting and gazing the “infinitude” while delayed at the airport is a real time killer option. Why not to get some ideas about how to keep your body and mind busy in or out the waiting room?
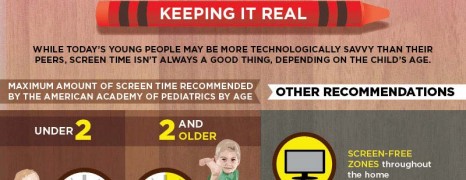
Digital Children
visualized by: Early Childhood Education Degrees
Today’s preschool children experience unprecedented exposure to new media and technologies involved. Though technology literacy is becoming a prerequisite even from a child’s early school years, experts alert that parents should draw a red line before they start realizing the very first addiction symptoms.
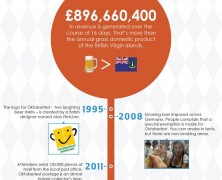
Oktoberfest History
visualized by: Neo Mammalian Studios
In the wake of the 180th celebration of Oktoberfest, this infographic comes to summarize the historical highlights of the most popular festivity of German culture and tradition.

Student Spending Habits UK
visualized by: Natwest
An insight into what students say they spend a month compared to what their parents say they think their children spend per month

Game Development Costs
visualized by: nowsourcing.com
Do you have any idea of the costs involved in game development ? Here you see 6 examples from various times in game industry history with production cost and sales volume. Following there’s a typical $10 million budget breakdown and some reference to the options available for funding a game idea.

Salvador Dali Biography Timeline
visualized by: Giorgia Lupi & Michela Buttignol
Get to know better the life and work of one of the most controversial, experimental and offbeat painters who was soundly influenced by the Dada movement and is considered the master of surrealism. Lights on Dali.

From Vine to Wine
visualized by: Frei Brothers
Discover the technologies that can save up natural resources like water and upgrade wine production to energy efficient process without losing a bit of taste and quality
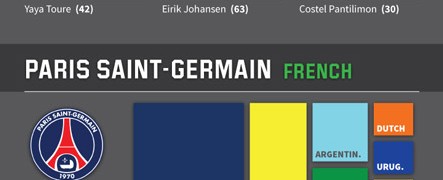
Champions League 2014 Clubs
visualized by: Neo Mammalian Studios
This graphic presents 10 elite football clubs of UEFA Champions League and their nationality synthesis along with some predictions on win odds based on club and nationality.
")