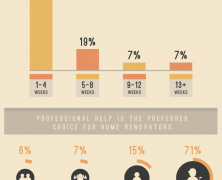
Britons like to tackle home improvement projects either for maintenance purposes or for adding value to their property. This graphic breaks down the demographics, budgeting and most common works of home renovation acroos the UK.
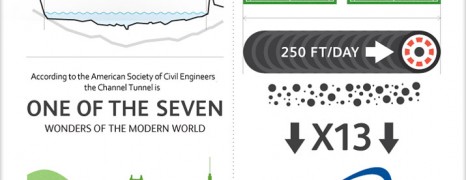
The Chunnel Marvel
visualized by: OMD UK
20 years ago, undersea commuting between France and the UK was a vision and construction challenge to pursue for both ends. Now that the channel tunnel has become a reality, the vast majority takes for granted this engineering feat. Read the numbers behind the tunnel straight from the constructor’s mouth.
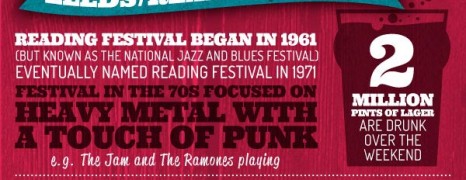
UK Festival Highlights
visualized by: Go Outdoors
Go Outdoors have compiled this infographic giving us a snap shot of the biggest music festivals in the UK, as well as a timeline on how it all started. Have a look at capacity, attendance and installation statistics nicely blended with interesting facts and highlights.
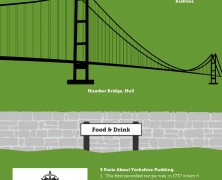
Magic Yorkshire
visualized by: Breaktheseal
A look at what makes the county of Yorkshire so special both internationally and to the people that live there. From the iconic buildings, to the famous faces and the food this infographic breaks down the various areas that Yorkshire has become renowned for.
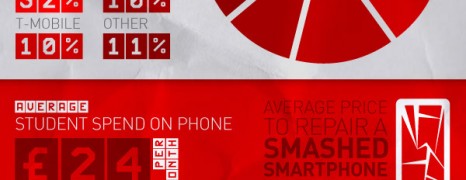
Student Smartphone Addiction
visualized by: The Snugg
Insights and demographics of smartphone usage among student individuals in the UK. This report presents the types of activities that phones are used for as well as the total amount of time spent using smartphones and the most popular apps, phone brand, and network providers in the UK.
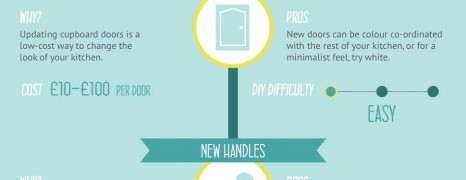
Kitchen Makeover Budget
visualized by: Neo Mammalian Studios
A new kitchen in the UK kitchen furniture market costs about £8,000. Following the tips presented here you could save up some pounds or avoid a budget overrun at least.
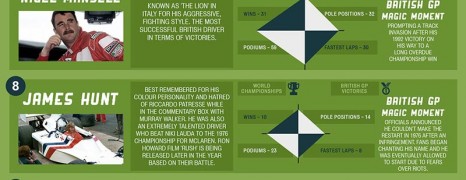
Best British Grand Prix Drivers
visualized by: Neo Mammalian Studios
Britain has a notable legacy in motor racing with top winning drivers’ arsenal both in world and national championships. This infographic comes to document the most influential British racing drivers.
UK Festivals 2013
visualized by: CALOR
Summer is on and festival goers already feel the beat under their feet rumbling. With more than 500 music festivals scheduled in 2013 across UK and Ireland, chances are that you will find one or more to enter the party. See 5 from the big and the smaller ones as a starter and check if you have the basics to rock easy.
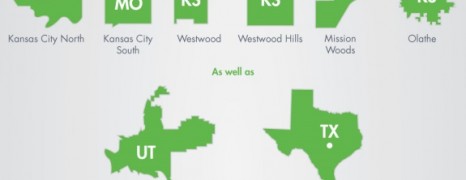
Google Fiber Potential
visualized by: Neo Mammalian Studios
Google fiber is currently the fastest and the cheapest ISP compared to top ISPs both in the US and UK. For the time being only Kansas City and Central Kansas City enjoy the whopping speed of 1GB/sec. What holds the future in terms of upsizing?
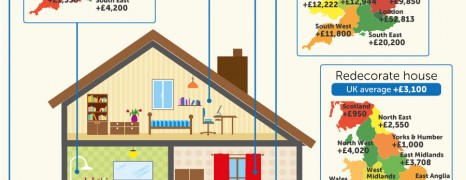
UK Home Make Over Value
visualized by: Vibrant Doors
How much value can UK home owners add to their properties with home improvement tasks? Find out the mark up effect of each work mapped by UK region.
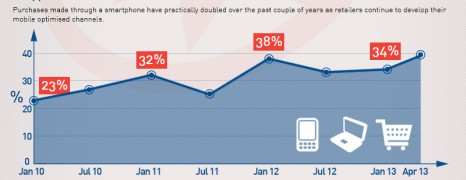
UK Mobile Commerce Growth
visualized by: eDigitalResearch.com
With the smartphones being a mainstream rather than a luxury, mobile commerce shows striking growth that largely lies in the adoption of mobile optimization from retailers end. This report offers some insights about UK mobile market and Britons’ online shopping habits.
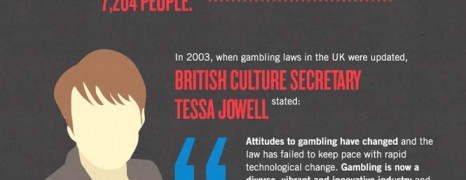
Online Gambling Economics
visualized by: Neo Mammalian Studios
Online Gambling grows by leaps and bounds and this report examines the magnitude of this controversial market in UK, USA and Australia. Further, it pinpoints the effect a more resilient and updated statute could have on national economies via taxation.
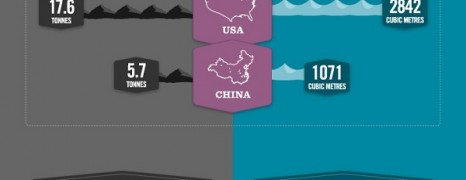
Carbon Footprint vs Water Footprint
visualized by: Neo Mammalian Studios
Reducing our carbon and water footprints could help us save money but above all Earth. Learn how water and carbon footprint is assessed, what is the average per capita carbon emission and water consumption in UK, USA and China and what we can do to better control the situation.
World Dept Uncovered
visualized by: Doctor Who?
2008 was the year that the economic crisis bell rang. Credit crisis, recession, deficit, austerity, debt are some of the terms that started circulating across the nations hitting both robust and scrambled economies. This infographic outlines the situation with the world debt.
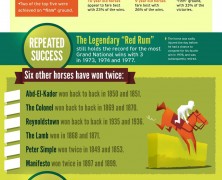
Grand National Horse...
visualized by: Mirror.co.uk
Mirror UK in co-operation with Trinity examine 165 years of Grand National history to hunt down the trends and find out just what makes a Grand National champion.

New Home Exploration
visualized by: Epiphany Solutions UK
Moving out our old home we regularly know what we leave behind and what we get. Moving in a new home might end up to a surprising experience however. See what Britons came upon across the UK dominion when they rummaged their new base after moving out.
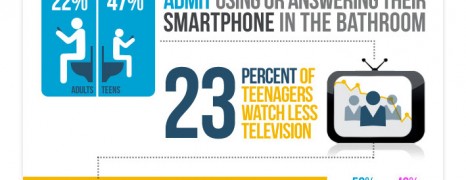
Smartphone Addiction UK
visualized by: Epiphany Solutions
Smartphone deprivation syndrom seems a fitting term variation that best describes the situation with smartphone addiction that hits both teens and adults worldwide. This report spotlights the situation in the UK market.
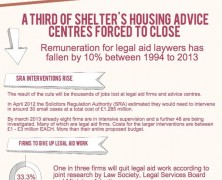
UK Legal Aid Cuts
visualized by: Neo Mammalian Studios
600.000 people in the UK are going to deprived of their right to legal advice and support from today 1st April 2013. This report highlights the changes being made to the legal aid system and raises questions about the societal effect of this measure.

Credit Card Scam Protection
visualized by: Neo Mammalian Studios
At £341 millions is estimated the total loss for UK banks due to credit card scams in 2011. As banks and credit card networks are striving to develop even more advanced methods for fraud prevention, so do swindlers manage to find new techniques to break the shield. Learn about the most common scam methods and how to secure your digital pocket.
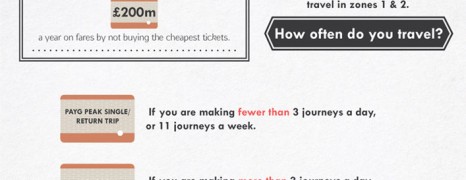
Saving on UK Commute
visualized by: Neo Mammalian Studios
The average annual cost of commuting to work in the UK consists a considerable portion of a Briton’s median salary and it is estimated around £1,775. See how you can save money on your commute.