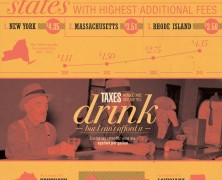
The government seems to delight in taxing the vices of it’s people. Anyone who buys alcohol or smokes cigarettes can attest to that. This infographic looks at sin taxes across the nation.
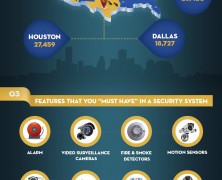
CCTV Your Home
visualized by: CCTVHotDeals
To make the ultimate burglarproof home is almost impossible. Burglars will always use advanced technologies that can break even the most sophisticated security systems. However, CCTV can thwart them from plundering you property.
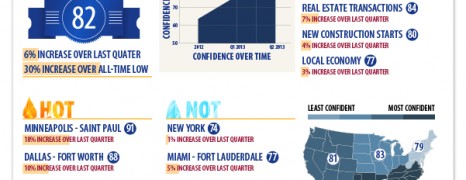
Real Estate Projections 2013
visualized by: RealEstate.com
1,767 real estate professionals are surveyed by RealEstate.com to express their views regarding the past and present health of their local markets. now and then than they have been for years. Realtors anticipate that all aspects of their markets will improve.
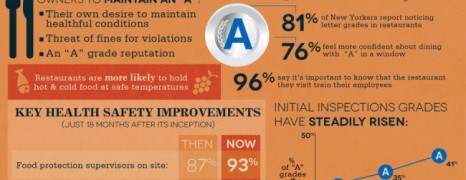
Food Safety in New York
visualized by: nowsourcing.com
New York, a metropolis with plenty tasteful temptations and a great variety of cuisine options all available at various price ranges. Food safety is major concern for New Yorkers and thus they developed a merit rating system for restaurants as a measure against the rise in foodborne illness. See how it works.

New York Fashion Industry
visualized by: nycedc.com
It belongs to the top fashion-cities’ quartet and largely supports a great portion of the worldwide fashion industry and US domestic economy. See the numbers behind the glamour, luxury and creativity.
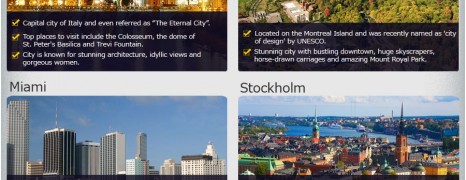
Top Travel Destinations for Men
visualized by: Graphs.net
Are you a single man? Free as a bird? Pack your suitcase and get ready to fly to one, two or even more of these must visit places to find what you are looking for either it’s adventure, or sightseeing, cultural wandering, nightlife and sex.
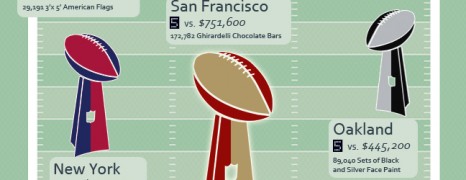
Super Bowl + Real Estate
visualized by: RealEstate.com
What a correlation! NFL teams that have gone to the Super Bowl many times tend to come from cities with high real estate prices. Teams like the San Francisco 49ers, New York Giants, and New England Patriots are highly successful in terms of the number of times they have made it to the Super Bowl and come from cities with absurdly high home prices.
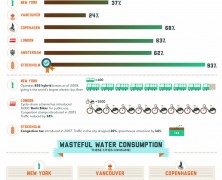
Top Green Cities
visualized by: HouseTrip.com
Year 2009 was the first one with decreased Carbon emissions by 0.3% since 1998. But this is just a drob in the ocean. See which countries are the green leaders showing their enviromental responsibility in action.

Most Populous Cities
visualized by: Guardian.co.uk
See the world’s 23 mega-cities and the imminent growth of 14 more with 9 of them coming from Asia. Find also historical, demographical and living condition facts showing that residents’ life quality strongly relates with development consistency.Nice interactive maps developed by the Guardian interactive team and documented by the UN.
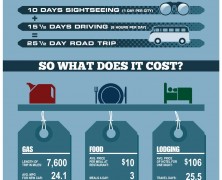
USA Road Trip Cost
visualized by: GasBuddy.com
Ready for adventure? I Drive Safely and GasBuddy bring this tempting report breaking down the cost of a trip around USA’s top 10 vacation cities.
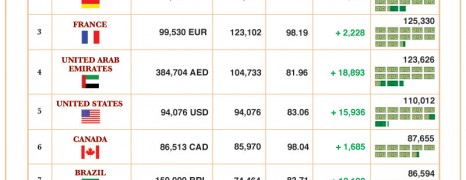
Attorney Salary Trends
visualized by: Maximilian Bode
A look over the average attorney salaries in 14 countries around the world along with analogic comparison against living cost in New York. More info less graphic but it’s ok if you are in the law tribe.
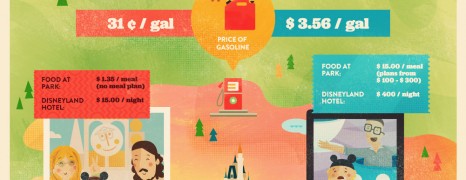
Family Vacations Past and Present
visualized by: AUTHORITYshops
Read about some interesting cost comparisons for family road trip to 3 polular destinations between 2012 and 60’s.
Mobile Usage While Travelling
visualized by: Tripl.com
Mobile device usage is on the rise even while on the road with the majority of users love sharing and documenting their travel experience. Tripl has published its commercial report showing statistics o travelers’ activity through their devices.

Complete Guide To July 4th Fireworks
visualized by: oBizMedia
Com’on baby light my fire! Celebrate with style and knowledge and burn your money responsibly.
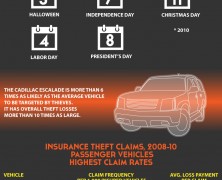
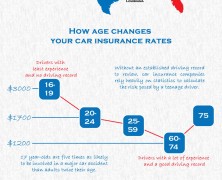
Car Theft In The Us
visualized by: IAATI
Hundreds of thousands of cars are stolen across the US. Few owners ever see their vehicle again. Honda Accord is thieves’ favorite. Read the safe measures at the end.
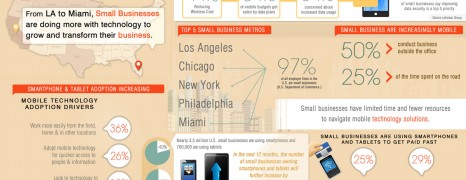
Small Business Mobility
visualized by: T Mobile
Small businesses in the US are increasingly adopting mobile technologies and doing more to grow and tranform. However taking control of the expenses on mobile data plans is a major concern. See the level of mobile utilization they implement.
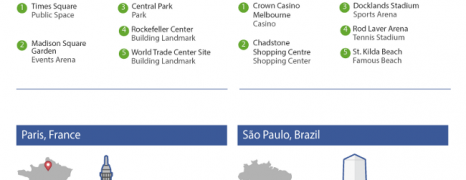
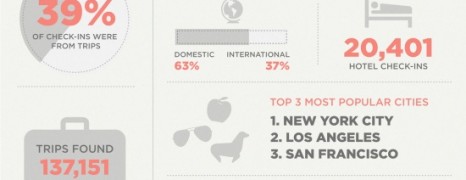
Facebook most social cities
visualized by: Facebook
People everywhere use Facebook to check in to places. Here you can see the 5 top hotspots of the most “social”cities.

Brooklyn Boroughs
visualized by: JD Gardner
A tribute to Brookllyn borough including access info, demographics, city highlights and celebrity references.