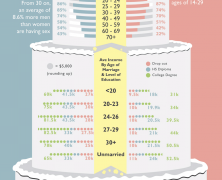
Both American men and women tie the knot 7 years later than they used to in 60s. Is this due to career issues and demanding modern lifestyle or just to inclination to a more careless living? This graphic breaks down the wedlock of modern Americans.
American Family Stories
visualized by: Ghergich&Co
Have a look at some historical statistics showing the vast change in marital state demographics across the US and in family structure conception.
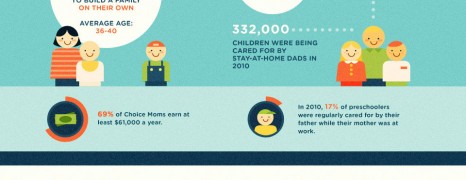
Child Raising Costs
visualized by: Neo Mammalian Studios
Are you expecting your newborn? Are you planning to do so? Do some budgeting before you start feeling the burden of a financial woe.
Reading this graph you’ll get an idea of how the cost of raising a child till adulthood fluctuates based on data from the UK market.

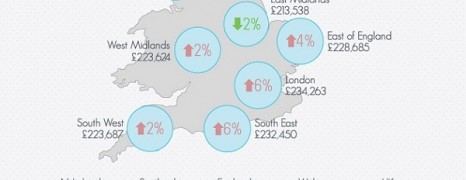
Do Before Buying House
visualized by: RealEstate.com
Are you one step before putting down roots? You better think it twice, as owning a house entails serious responsibilities and commitments. The buying decision should encapsulate firm answers to a series of questions that this flow chart brings to the front. Are you ready?
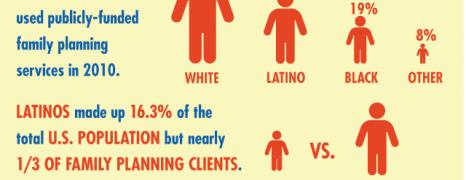
Reproductive Health Care Retrench
visualized by: ColorLines.com
284 000 Texas women are projected to lose reproductive health care in 2013 due to family planning budget revision. See the rest 25 states that enacted 69 anti-choice measures in 2011.
")