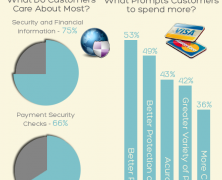
19000 consumers from 14 countries across the world were surveyed regarding their online spending habits. See a rundown of the global online shopping behavior based on data as of 2012 and the emerging opportunity of mobile shopping that marketers should get in hand.

WordPress Theme Anatomy
visualized by: Graphicmedia
New to Wordpress? Read this quick graphic to get to know the backbone of a wordpress theme.

ZMOT Marketing Strategy
visualized by: Media Mosaic
This graphic focuses on three common challenges marketers encounter. The BAP, PEP and PDP problems. Not familiar with these abbreviations? Find them here along with guidelines of detailed zmot strategy and multiple media which should be integrated collectively to win the zero moment of truth battle in online marketing.

Mobile Apps Marketing 101
visualized by: ZealousWeb Technologies
Smartphone Apps or mobile apps marketing trend is converging among the avid personnels. If you want your app to be recognized by the whole world, then there are some crucial points to be kept in mind while developing and designing. Because in this competitive world of app development and marketing, there are millions of apps in the market. Thus, marketing for your app perfectly by targeting the exact niche becomes vital.
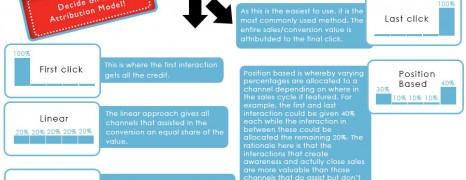
Marketing Attribution for Dummies
visualized by: dpfoc.com
Do you know what parts of your marketing budget generate positive ROI and what parts you should cut out? Tracking and monitoring of multi-channel campaigns on modern media is a real challenge. This infographic focuses on the importance of conversion attribution and initiates marketers to the attribution web in order to get the data that they need to make informed decisions on their marketing mix.
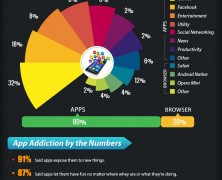
Addicted to Apps
visualized by: Graphs.net
The infographic is based on the most used and addicted apps for mobile, based on the research done by the MTV and other sources to know the rate of addiction of people for Applications.
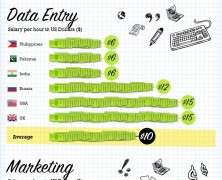
Online Jobs Salary
visualized by: Staff.com
Based on oDesk ‘s aggregated data for online jobs’ salary demand, this report from Staff.com gives the whole picture of how labor hour for distance working is valued around the world. 4 of the most popular fields are examined including Web Development, Data Entry, Marketing and Mobile App development.
Storytelling B2B Marketing
visualized by: Look Book HQ
Say it with a story and you’ll steal the spotlight. People from Look Book HQ highlight the importance of storytelling to B2B marketing as the most effective practice for standing out from the crowd captivate your prospects’ interest.
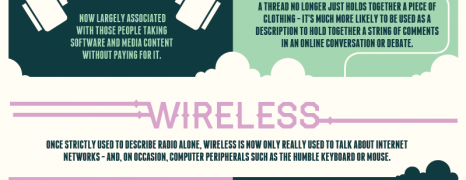
New and Old Tech Terms
visualized by: Lebara UK
The future of technology has altered the words we use on a daily basis for years. Here is a look into the future, and how tech might change our language further.
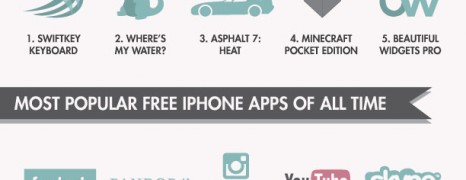
A World of Apps
visualized by: Insurance2Go
App Store becomes already five and and this graphic comes to resume how the two smartphone app giants perform in popularity for paid and free apps and revenue. Following to the statistic part you will find 8 key factors that make an app great.
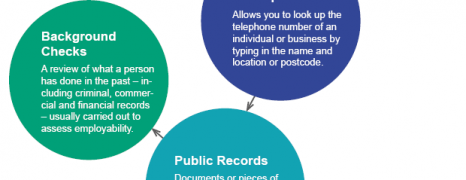
Tracking Down Lost Friends
visualized by: Strategy Internet Marketing
In the era of online media boom are you still find it hard to track down people from your past? Either it’s about a friend of yours or a relative, people from White Pages give us the path that will make your “investigation” plain sailing.

Top Tennis Players on Twitter
visualized by: Neo Mammalian Studios
This infographic depicts the Twitter activity and performance for 8 of the biggest tennis players in the world and examines whether their Twitter reputation match up to their amazing earnings.

Outsourcing Industry Overview
visualized by: Time Doctor
1998 was the start year for one of the most popular online outsourcing platforms (Elance) that paved the path for the looming of outsourcing industry. This graphic by Time Doctor breaks down the competition among 4 of the biggest freelancer online boards including Elance, oDesk, Freelancer and 99designs.

Video Virality Economics
visualized by: masters-in-marketing.org
Guys from Master in Marketing spotlight some representative examples of online video content from YouTube in an effort to show its power in terms of user engagement and virality and how this integrates with advertising.

WordPress Security Threats
visualized by: Graphs.net
Though Wordpress has managed to enter the mainstream of web development and stride to the forefront of CMS, that doesn’t mean that it’s invulnerable. Here you see an overview of the most common vulnerabilities, security holes and hacking practices for wordpress based sites and blogs as well as some basic advice on how to “guard” a WP installation.
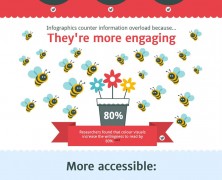
Infographic Rush
visualized by: Neo Mammalian Studios
Our favorite infographic content affiliates, Neo Mammalian Studios, utilizing parallax FX shed some light on the intellectual background of the question “Why people love Infographics?”. Here you see the static version but it pays out to see the motion graphic implementation by following the publisher link on the left.

Mobile App Marketing Guide
visualized by: DotComInfoWay.com
This infographic pinpoints 7 “commandments” of mobile app marketing by using the classic good vs evil approach to help you better understand the dos and don’ts steps. It provides a visual process of app promotion phases from reaching the right audience to continuous marketing efforts that will crown your app.
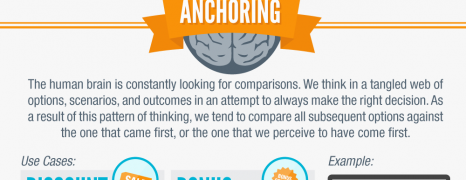
5 Conversion Rate Tips
visualized by: Pardot.com
Online marketers, have a look at these five keen techniques based on the principles of behavioral psychology theory that will help you spike the conversion rates of your marketing campaigns and crowd the sales funnel.
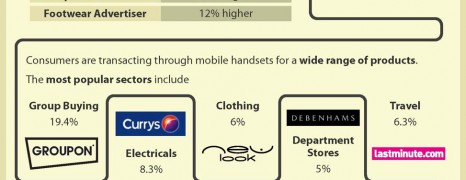
M Commerce Growth 2013
visualized by: AffiliateWindow
No guess that mobile commerce thrives. Part of this trend lies in the advent of advanced mobile technology both for handsets and mobile networks. But does this technological breakthrough alone explain the shift in consumers’ shopping habits?
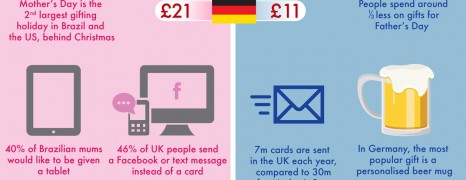
Mother vs Father Day Spending
visualized by: Rakuten
In the wake of the Fathers Day celebration, it fits good to see how the world spends on these occasions and how they stack up against each other. Contrary to what most of us would expect, it’s not the US that ranks 1st in spending per capita. Any guess?
")