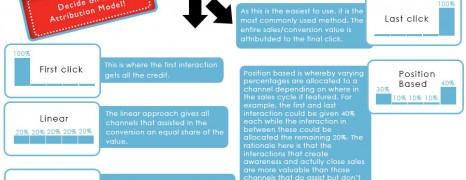
Do you know what parts of your marketing budget generate positive ROI and what parts you should cut out? Tracking and monitoring of multi-channel campaigns on modern media is a real challenge. This infographic focuses on the importance of conversion attribution and initiates marketers to the attribution web in order to get the data that they need to make informed decisions on their marketing mix.
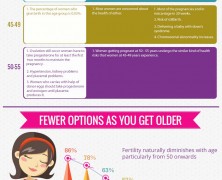
Mothers over 50
visualized by: Graphs.net
Wondering about the chances and complications of a mother expecting after 40 or 50? Find here possible procedures and tips that wannabe mothers should follow after the age of 50.
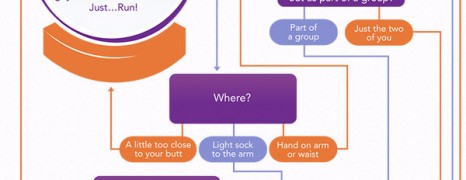
When a Man Loves a Woman
visualized by: Hollywood Psychics
Stop playing with the daisies. Things are clear when a man loves a woman. Girls, walk through this flowchart and get a sentiment crash test to realize if your “hero” has some true feelings for you. It’s your call now to decide if he’s worth your time.
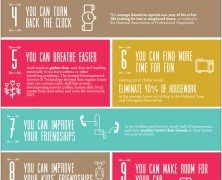
Tidy Home Benefits
visualized by: nowsourcing.com
Do you belong to the lazy ones who are quite accustomed to the mess accumulated day by day in your home? Sparefoot gives us 15 solid reasons for bringing tidy under the roof.
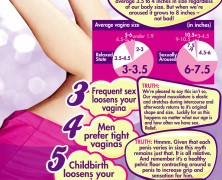
Tight Vagina Myths
visualized by: savvi.com.au
Whether you’re a man or a woman, you’ve probably spent many times in your life thinking about the female anatomy or more precisely the vagina. There are some myths surrounding tight vagina and this infographic comes to debunk them for good.
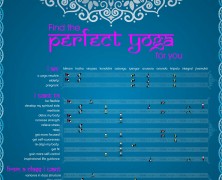
Yoga Types Chart
visualized by: HealthandFitnessYoga.com
Finding your perfect yoga type match can be a pain. Either in entry or advanced level this chart helps you to better match your experience, needs and class attitude choosing from a pallet of 11 most common yoga styles.
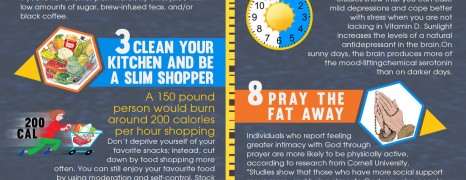
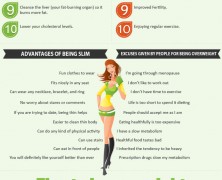
Essential Weight Loss Tips
visualized by: AGC
Keeping a well-shaped body and achieving a healthy mental and physical condition is a matter of mindful choices regarding our lifestyle that pertain to quality food selections, exercising, socializing or even time management of our routines. This chart makes the complex simple by enumerating essential ways for self-enhancement and personal advancement.
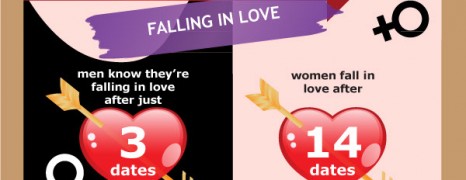
Dating and Relationships Facts
visualized by: be2 dating
The online dating and matchmaking website “Be2” has put together fun and interesting facts about dating, relationships and gender stereotypes in general. See the infographic with a fun and colorful comparison of gender stereotypes.
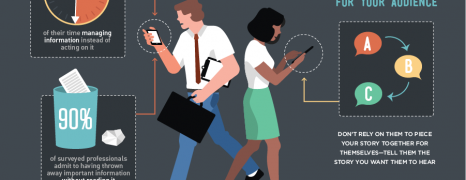
Storytelling B2B Marketing
visualized by: Look Book HQ
Say it with a story and you’ll steal the spotlight. People from Look Book HQ highlight the importance of storytelling to B2B marketing as the most effective practice for standing out from the crowd captivate your prospects’ interest.
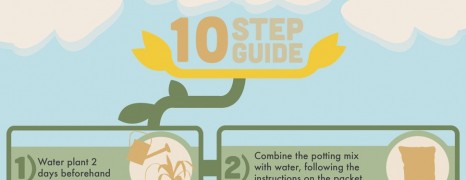
Repotting Houseplants Tips
visualized by: Neo Mammalian Studios
If your houseplants look in need of repotting read this easy-to-follow infographic to learn how to revitalize them and excel in gardening.
Fat Burn Foods
visualized by: Graphs.net
If losing weight is one of your major concerns this period, this guide comprises decent tips that will help you find your way to a healthier living with less fat and a better body shape.

Baby Nutrition Guide
visualized by: Graphs.net
When it comes to your little baby you want the best. This graphic gives new parents an overall view of the healthiest foods they should feed their little throughout the first 3 years of its development that reportedly are the most critical ones.

Bridesmaid Styling Tips
visualized by: Debenhams UK
What makes the best, the most dazzling bride? Her well fitted and styled maids. This guide offers tips on how to cover up imperfections for 4 of the most common female silhouettes and examples of best match bridesmaid dresses for various wedding themes.
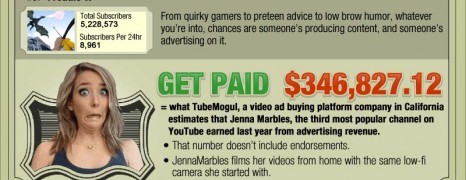
Video Virality Economics
visualized by: masters-in-marketing.org
Guys from Master in Marketing spotlight some representative examples of online video content from YouTube in an effort to show its power in terms of user engagement and virality and how this integrates with advertising.
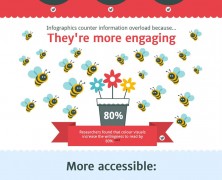
Infographic Rush
visualized by: Neo Mammalian Studios
Our favorite infographic content affiliates, Neo Mammalian Studios, utilizing parallax FX shed some light on the intellectual background of the question “Why people love Infographics?”. Here you see the static version but it pays out to see the motion graphic implementation by following the publisher link on the left.

Mobile App Marketing Guide
visualized by: DotComInfoWay.com
This infographic pinpoints 7 “commandments” of mobile app marketing by using the classic good vs evil approach to help you better understand the dos and don’ts steps. It provides a visual process of app promotion phases from reaching the right audience to continuous marketing efforts that will crown your app.
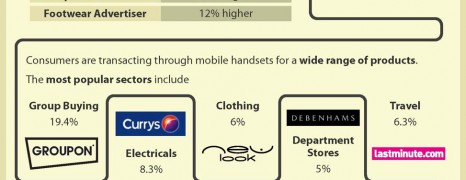
M Commerce Growth 2013
visualized by: AffiliateWindow
No guess that mobile commerce thrives. Part of this trend lies in the advent of advanced mobile technology both for handsets and mobile networks. But does this technological breakthrough alone explain the shift in consumers’ shopping habits?
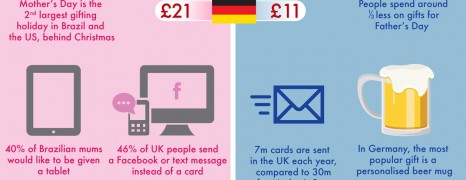
Mother vs Father Day Spending
visualized by: Rakuten
In the wake of the Fathers Day celebration, it fits good to see how the world spends on these occasions and how they stack up against each other. Contrary to what most of us would expect, it’s not the US that ranks 1st in spending per capita. Any guess?
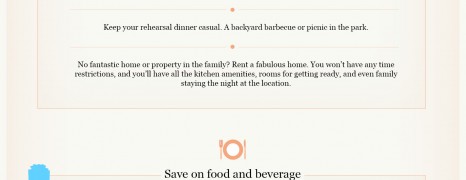
Save on Wedding Tips
visualized by: Kenzie Comstock
Wedding cost can add up quick. But you can cut on the cost when planned right. From the season you have your wedding to the location of the reception, it’s all up to you to determine how much your wedding will cost. Have a look at wedding economics and the options you have if you are on a tight budget.

Baby Home Safety Tips
visualized by: Neo Mammalian Studios
Once your baby starts toddling, you will be in need of better protection against the various lurking dangers from appliances, surfaces, furniture home units etc. that threaten your beloved one’s safety. Here you will find some ideas for baby-proofing as well as some advice regarding the revision of your home insurance contract.
")