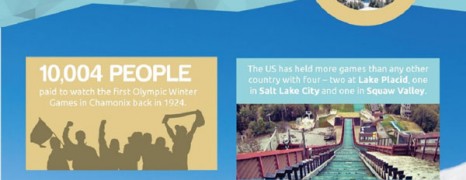
5 months left for Winter Olympics 2014. Seven sports, 1300 medals and three mascots are just some numbers of the next games taking place in Sochi of Russia. Have a look back at some quirky facts from Winter Olympics history.
Brazil’s Thriving Economy
visualized by: KickStart Search
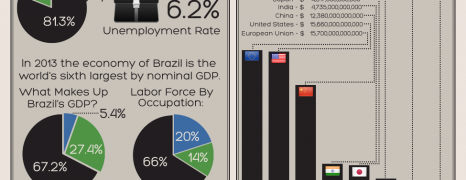
Today, Brazil represents one of the fastest and most up and coming economies in the world. Brazil is about to host the World Cup and the Summer Olympics in the next couple years. These two events will significantly change its infrastructure.This infographic depicts how far Brazil has come economically and where they will be going.
Olympics 2012 Hotels
visualized by: TrustYou.com
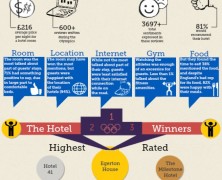
It’s the Hotels final sprint. How did they score in 5 major visitor experience criteria during the London Olympiad? A survey based on 600+ reviews and 3697+ raised sentiments.

Famous Olympic Buildings
visualized by: Megan Jett
These constructions are some of the most elaborated, inspired and costly setups built to host olympic events around history since 776 BC.
Olympics Records His...
visualized by: Lindsay Snow Osborn
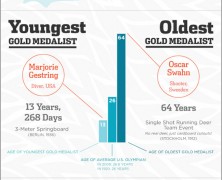
London 2012 was a smashing record Olympiad. Let’s recall the history of some olympic legends.
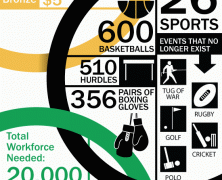
The Impact Of Olympics
visualized by: ClickSoftware
What are the resources needed to run a super Olympiad? What are the critical points and the extent of activity that should be considered by the hosting country on managing such a glorious event? Read the numbers that refer to 4 latest Olympic games.
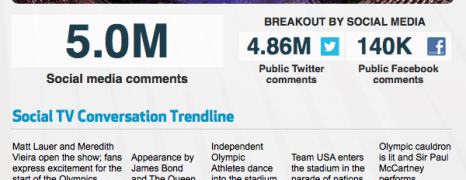
London 2012 social buzz
visualized by: Blue Fin Labs
See the facebook and twitter peaks during the Olympics 2012 opening ceremony broadcast.

Olympics Economics Impact
visualized by: CreditSeason.co.uk
Hosting the Summer Olympic Games is a great honor and challenge as well for any city. Read some comparison facts about the business background of the games starting with the Atlanta Olympics 1996.

2012 Olympics Swimming
visualized by: Creax.com
A retrospective study over the technological evolution and athletic performance in swimming.
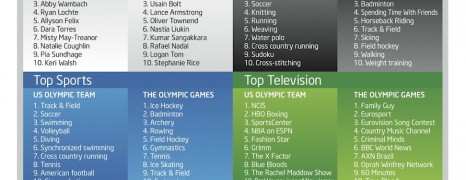
Facebook Olympics 2012
visualized by: Compass Labs
Some social insights based on data from the official US Olympic Team page and the Olympic Games page on Facebook.

Brands social performance in olympics
visualized by: PappasGroup.com
A nifty infographic perfectly adapted to the olympic sports spirit that shows the preformance and records of popular brands’ social media marketing activity compared with the ones 4 years back.
Olympics by Numbers
visualized by: MBAOnline
Some interesting facts and statistics both from the Olympic history and the running London 2012 Olympiad

Most Sponsorable Olympians
visualized by: Sponsorhub.com
SponsorHub attempts to rank the Olympians according to their commercial value for brands. That means that they measure their social influence together with their records to give out the classic top 3. See who wins.

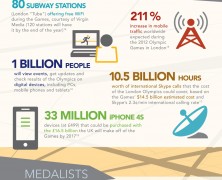
London Summer Olympic Games
visualized by: TECHBARGAINS
Predictions over London 2012 Olympic watchers’ behaviour. Who will be watching the events, what they will share on social media, what devices will they use?

Team Gb London 2012
visualized by: tamar.com
A tribute to Great Britain’s Olympic team including records and statistics. Get to know them.
Olympics Mobile
visualized by: acmepacket.com
Read about interesting facts related to mobile technology utilization through the Olympics’ history. Even in the BC ages pigeons were a form of mobile communication.
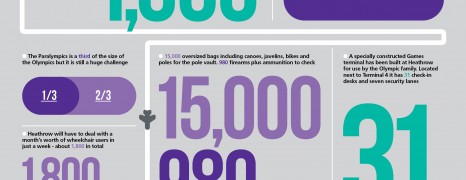
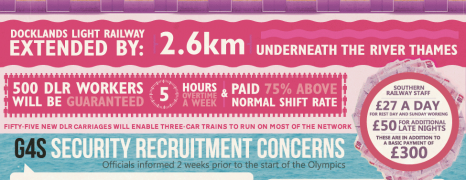
Heathrow Olympic Congestion
visualized by: Heathrow Airport
See remarkable figures in regards to Heathrow traffic management on the tick of the 2012 Olympiad opening.
Olympic Sponsors’ Advertising Race
visualized by: Unruly Media
The hard race of official Olympic sponsors to win the gold metal in viral content performance generating smashing social buzz. It’s a true race – enjoy till the finish.
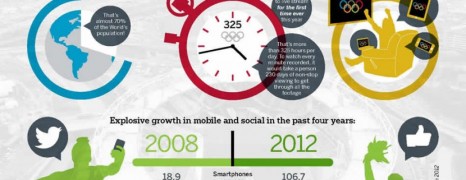
Online media and Olympics
visualized by: iProspect
Here is illustrated the social activity and mobile usage boom comparing statistics of 2 olympiad periods, one of Beijing 2008 and the present London 2012

Olympic Sports Evolution
visualized by: Doctor Who?
The start and finish of the olympic sports throughout the history of the games on a simple timeline. Some have a long living while some others happened just for one olympiad.
")