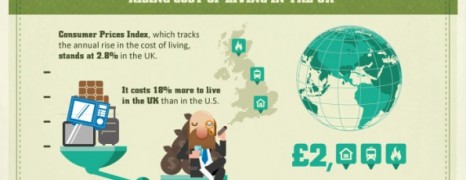
Get a picture of wealth distribution among UK residents and the impact of inflation on the purchase power of 1 million pounds and real estate market over the last 20 years.
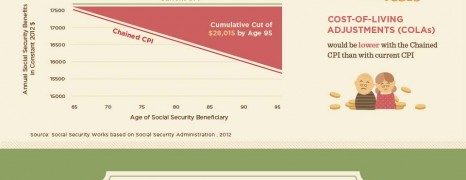
Retirement Crisis in US
visualized by: Ghergich&Co
This infographic gets down to the boiling situation with the social security act of Obamacare scheme and presents how the various methods for social benefit and retirement calculation affect the annual income of beneficiaries.
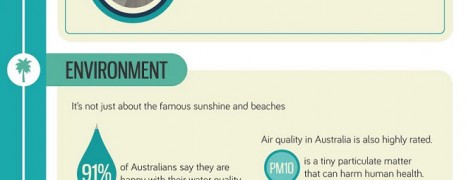
Australian Wonderland
visualized by: Neo Mammalian Studios
From beautiful beaches to fabulous cities, Australia is the happiest place on earth to live. And it’s not only the sun, the sea and the landscapes that make this statement solid. Far from it, it’s the OECD report that ranks Aussies as the happiest citizens based on 11 happiness factors.
Child Raising Costs
visualized by: Neo Mammalian Studios
Are you expecting your newborn? Are you planning to do so? Do some budgeting before you start feeling the burden of a financial woe.
Reading this graph you’ll get an idea of how the cost of raising a child till adulthood fluctuates based on data from the UK market.
Personal Finance Tips 2013
visualized by: Beckon Media Inc
New year – new plans – new challenges. If you are prediciting tight finance for 2013, this infographic will show you 13 different money saving tips that will help you save a combined total of $11,244.00! How? By simply adjusting your daily life and making choices that will help you take control of the situatiion.

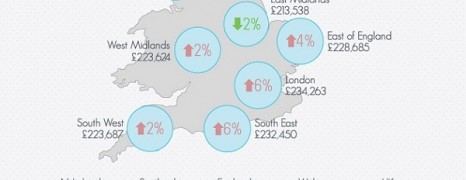
British Salary Distribution
visualized by: thinkmoney.co.uk
Here is the story of how the british monthly salary blows. Mortgages, rent, bills, mobile communications? You may be surprised what you find. There are also some handy hints which could help you along in 2013!

Retiring in Asia
visualized by: Graphs.net
Changing your life plan at a late age might sound a bit overwhelming. However, even more westeners are choosing Asia for retiring. There must be some good reasons that happens.

US Attorney Income
visualized by: oBizMedia
How much do Attorneys make in the US? How are their earnings compared to the cost of living accross the states. A payroll report for law professionals in the top 20 US Markets
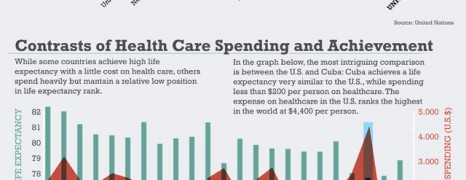
Healthcare Spending vs Life Expectancy
visualized by: Marco Giannini
Contrary to the common sense, life expectancy rates are not proportional to the spending for healthcare services in many countries. US proves to be the worst perfomer regarding this analogy while other countries with limited funds and less industrialized achieve more.
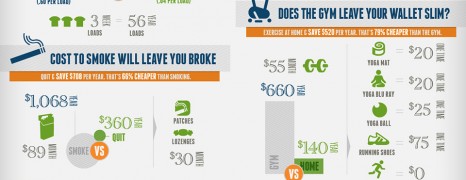
Green Lifestyle
visualized by: nowsourcing.com
Going green means saving green in the long run. See a living cost copmarison between green and typical lifestlye of various age groups to find the side you belong to.
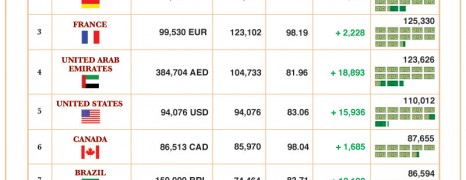
Attorney Salary Trends
visualized by: Maximilian Bode
A look over the average attorney salaries in 14 countries around the world along with analogic comparison against living cost in New York. More info less graphic but it’s ok if you are in the law tribe.

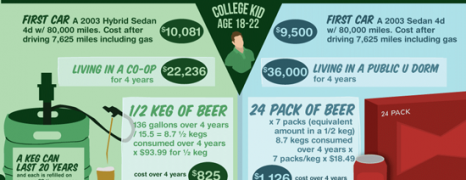
Cost of Raising A Child
visualized by: FaceTheFactsUSA.org
It takes more than courage to raise a child. Please check your bill before breeding.
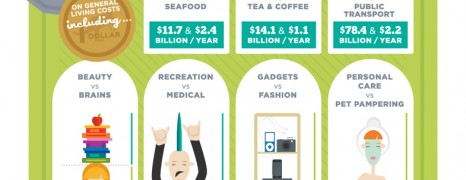
Australians Spending Habits
visualized by: MoneySmart.gov.au
Australian Government eagers to help and guide Australians to make better financial decisions. To this direction, it gives out this spending pattern review and suggests taking control of their expenses by making use of its new mobile app.
")