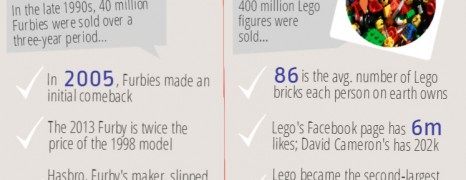
The numbers are in! One thing that’s always in demand at every Christmas holidays is toys! 2013 has been no different. This presentation looks into what captures most kids interest this year in the toy department.
White Lies Parents Say
visualized by: Neo Mammalian Studios
Depending on the country you grew up in, you have probably heard some of these little white lies from your parents’ mouths.

Impact of Birth Order on Personality
visualized by: Best Psychology Degrees
This infographic addresses the theory that’s been around for centuries, according to which the birth order partially or strongly affects the personality of the individual. Does this ring true with your family?
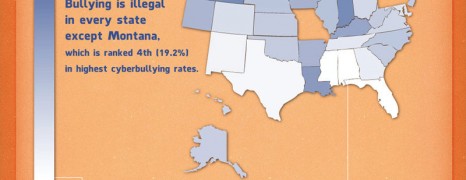
Teenage Cyber Bullying Statistics
visualized by: EricPhillips.net
Cyberbullying belongs to the most common cyber crimes and threats happening on the interwebs. Though online bulling occurrence rates are lower than offline (traditional bullying), statistics indicate that cyberbullying increases the likelihood of suicide.

Teenage Driver Facts
visualized by: Safer America
This infographic on teen driving safety talks about the most dangerous times for teenagers to drive, provides some staggering statistics, suggests tactics for parents to use in educating their children on driving safety, and offers recommendations on the safest automobiles.
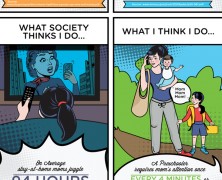
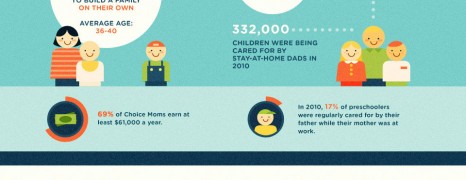
Moms at Home Duties
visualized by: Ghergich&Co
A comic like collection of memes rather than a typical infographic that communicates directly common misconceptions going around about moms staying home. Can we realize the real chores and duties they accomplish on a daily basis?
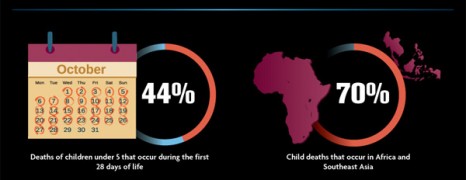
Global Infant Mortality Rate Facts
visualized by: Social Work Degree Center
It’s distressing to see new life perishing due to inadequate or ineffective health system. This graphic presents the naked truth about infant mortality worldwide.
Halloween Safety
visualized by: CheckMate
Reportedly crime rate during Halloween night rises 50% more than any other night in some major cities in USA. Parents should be aware of the dangers lurking.
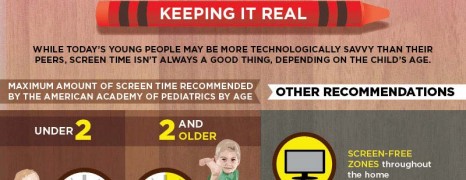
Digital Children
visualized by: Early Childhood Education Degrees
Today’s preschool children experience unprecedented exposure to new media and technologies involved. Though technology literacy is becoming a prerequisite even from a child’s early school years, experts alert that parents should draw a red line before they start realizing the very first addiction symptoms.

Student Spending Habits UK
visualized by: Natwest
An insight into what students say they spend a month compared to what their parents say they think their children spend per month
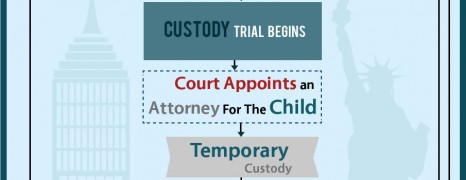
Custody Process NY
visualized by: Media Mosaic
With this nifty flowchart you will get an idea of the process of obtaining child custody through a court case in New York. If this is your case, read on to learn the details you should consider.
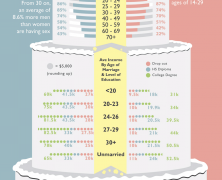
American Wedlock
visualized by: topcounselingschools.org
Both American men and women tie the knot 7 years later than they used to in 60s. Is this due to career issues and demanding modern lifestyle or just to inclination to a more careless living? This graphic breaks down the wedlock of modern Americans.
Pregnancy Failure Reasons
visualized by: Graphs.net
Getting pregnant is not as simple as ABC especially in the modern hectic city lifestyle. Reading this chart can help couples with conception issues to get a hint for the main cause of the problem and rise awareness for measures that should be taken for giving life to the their efforts.
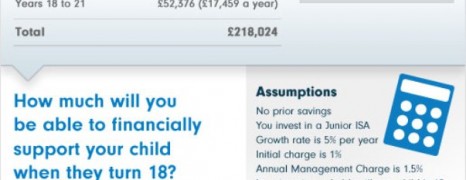
Cost of Raising Child in UK
visualized by: Fidelity UK
Child raising cost is estimated at more than £200,000 till the 21 years. See how much you could save by the time they turn 18 with a Junior ISA based on data from the UK market and give your little a head start.
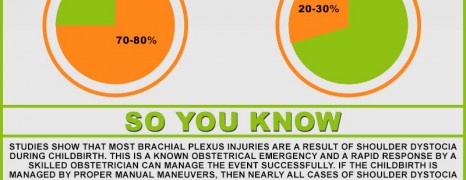
Erb’s Palsy Awareness
visualized by: Erbpalsy.org
What do you know about Erb’s Palsy? It’s an injury that affects infants during the birthing process and causes weakness or paralysis in the arm or shoulder. In an effort to rise awareness about Erb’s palsy, Arthur Sloane of “erbpalsy.org” compiled this report to show key stats and preventative measures for parents.

Baby Nutrition Guide
visualized by: Graphs.net
When it comes to your little baby you want the best. This graphic gives new parents an overall view of the healthiest foods they should feed their little throughout the first 3 years of its development that reportedly are the most critical ones.

IN App Purchase Protection
visualized by: Neo Mammalian Studios
What are in-app purchases, how to avoid them and how to keep your children away from them. This and much more on this fresh-cut infographic with the combined forces of Neo Mammalian ans MoneySupermarket.

Baby Home Safety Tips
visualized by: Neo Mammalian Studios
Once your baby starts toddling, you will be in need of better protection against the various lurking dangers from appliances, surfaces, furniture home units etc. that threaten your beloved one’s safety. Here you will find some ideas for baby-proofing as well as some advice regarding the revision of your home insurance contract.
American Family Stories
visualized by: Ghergich&Co
Have a look at some historical statistics showing the vast change in marital state demographics across the US and in family structure conception.
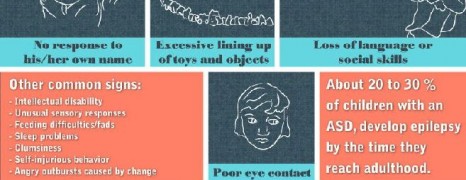
Autism Spectrum Disorder 101
visualized by: Nurse Degree
Did you know that autism is the fastest growing disorder among children showing a staggering high growth rate of up to 17% over the last 3 decades? NurseDegree.net presents an overview of autism and its overwhelming effects on personal, family and economic level.
")