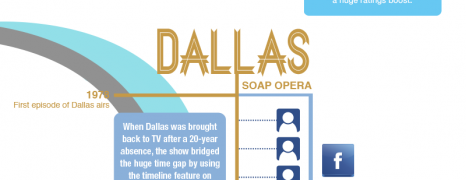
Contrary to the great concern of some specialists that the advent of social media would suffocate the television industry, even more shows are successfully adapting to the online social trend and transforming viewing to an interactive experience that captures even more viewers. Here are some outstanding examples.
All About Mr Rogers
visualized by: nowsourcing.com
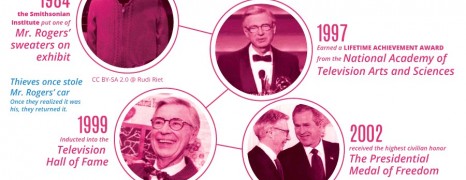
This infographic is a tribute to the life and work of Fred McFeely Rogers, widely known as Mr. Rogers from his 30 + years running TV show “Mr Rogers’ Neighborhood”. Have a look at his life-path and some of the most inspiring lessons.

Homes of Breaking Bad
visualized by: Neo Mammalian Studios
It’s amazing to see how the creators of “Breaking Bad” convey a character’s personality just by using color and furnishing. Check this infographic to find out more!
Game of Thrones Recap
visualized by: Connect Your Home
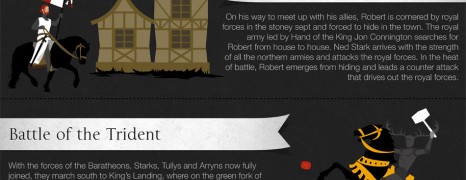
Game of Thrones can be confusing for someone that is just starting to get into it. With season 3 being underway, this infographic puts new and seasoned fans on the same rail recalling some of the things that have been happening in Westeros. Follow the publisher’s link to enter Season’s 2 Blu-ray giveaway contest that is still on.
Walking Dead Kill Count
visualized by: INFOgr8.com
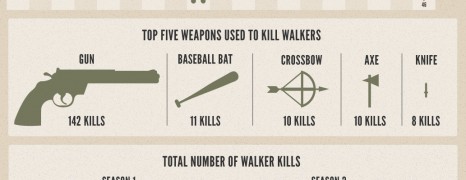
Is this the kingdom of blood? Just in two seasons the Walking Dead characters have committed 208 kills. That equals to 11 kills per episode! See who is the most skilled killer and which is the most used weapon.
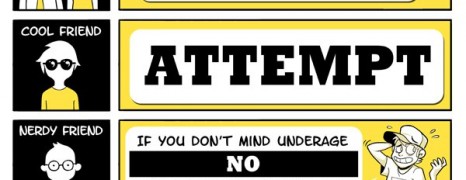
Cartooning Famous TV Shows
visualized by: College Humor
Sometimes it’s hard to describe and fully convey the spirit of something you adore to certain persons. In our case we are talking about tv shows like Doctor Who, Breaking Bad, Downton Abbey, Game of Thrones or an anime. What would be the approach if talking to your parents, lover, a nerdy friend or a work fellow?

Walking Dead Characters
visualized by: Doctor Who?
2 seasons of Walking Dead series are enough to fire the tv buzz. Here you’ll see the profile of each character and its dead or alive status.
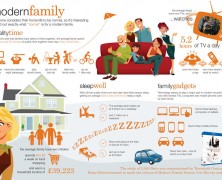
Modern Family
visualized by: Drench
Should the modern family be considered a normal one? What is normal for you? This study gives the averages of common habits and behavioral patterns of the Brit families in the name of Modern Family Season 3 DVD release.

Breaking Bad Death Toll
visualized by: tdyIF.com
Perfectly fitted to the script concept, this is dedicated to Breaking Bad fandoms. With 247 total deaths in this tv show spike it’s hard to calculate and tell which party trumps. Look into this periodic table and claim your diploma in “death chemistry”.
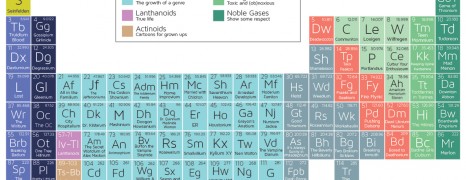
Periodic Table Of Tv Shows
visualized by: Doctor Who?
What’s the relation between chemistry and some of the most popular TV shows?