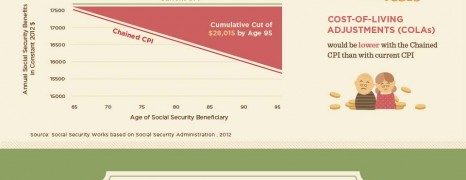
This infographic gets down to the boiling situation with the social security act of Obamacare scheme and presents how the various methods for social benefit and retirement calculation affect the annual income of beneficiaries.
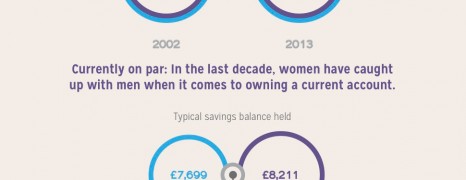
Gender Finance Divide 2013
visualized by: Neo Mammalian Studios
Some are better at making money, some at saving it, some at spending and few get on with all. Discover the who is who of money management.

Job Seeker Motivation
visualized by: Found
This survey unveils the needs and wants of job seekers and presents how the motivation-perks stack up against public sector, financial services, commerce and industry.
")