
Internet users have been increased by 528% since 2000. A whole new world with evolving digital habits is ready for action.

Google: Behind The Numbers
visualized by: busiinessmba.org
Google the Queen of the chessboard. Google’s revenue outnumber the GDP total of the 28 poorest countries. Here are the magic numbers.
The State Of Social Media 2012
visualized by: Seo Company
Social media have been utilized for various purposes from private and business activities to politics and activism. Here are some highlights for 2012.
How Google Works
visualized by: PPC Blog
Can you imagine the complexity behind your queries on Google search engine? A very inclusive sketchy flowcharft uncovers the science of what you see.

The History And Present State Of Domain Names
visualized by: Techking
Counting more than 90KK com domains and adding fairly more with the rest extensions, one would wonder “Which was the first domain ever?, Which are the most expensive?”. Would you?
The History Of Web B...
visualized by: Techking
Starting from 1994 with the legendary Netscape that drew the w3 stage curtains, web browsers carry their own history. Here you’ll see an interesting flowchart illustrating life and popularity through time.

The Web App Development Process
visualized by: Techking
Devloping a descent and promising web app is a serious task that requires to consider all phases of a process. Here you can find a quick guide.
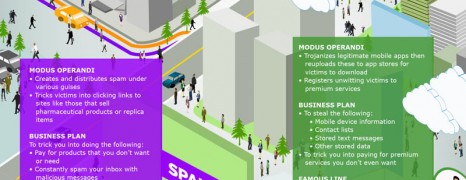
Know Your Enemies Online
visualized by: Trend Micro
Knowing who your friends are from your enemies online is your best defense against the online threats. A holistic overview of the various network threats and their names.

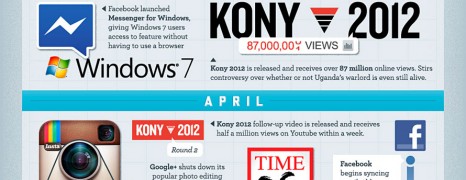
History of the Internet
visualized by: Doctor Who?
Browse through 21 milestones in the internet history. The media channel that changed our life and dominated the world.
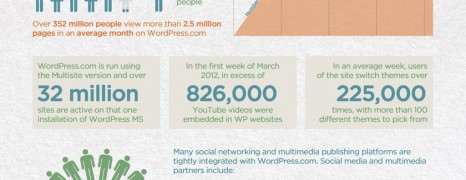
WordPress Stats A Global Phenomenon
visualized by: Yoast.com
Wordpress is ready to conquer the world of cms and with a 53% of the global market share is rightfully considered a phenomenon in the internet culture.
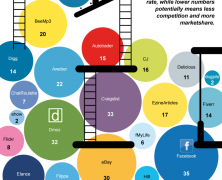
Web Clones
visualized by: REPUTATION OBSERVER
Amplification through replication. Industrial illustration of the lucrative business in web cloning. Just think how many copies of popular online concepts pop up randomly. But how many of them do substantiallly achieve to build up on the primary idea, diversify and last?

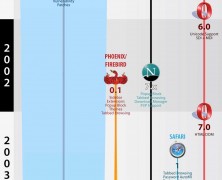
Web evolution timeline
visualized by: Vizzuality & Hyperakt
Absolutely interactive, handy and informational infographic showing the history of the internet in a nutshell. Includes selection option with separate screens referring to browsers – technologies and the general history.
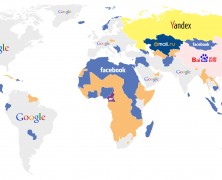
Dominating Websites
visualized by: Webempires.org
The eternal rivalry of the most robust web networks turns out to the worldmap domination distribution. Google power still prevails!

The World Without The Internet
visualized by: onlineeducation.net
The truth is that a world without internet would be totally different but definetly not better. If you belong to the generation X or Y likely you cannot even imagine it.
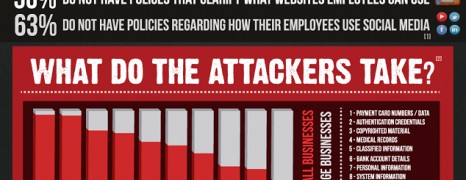
Small Business Cyber Security
visualized by: VERACODE
Small business owners consider their property like needle in haystack for the aspiring hacker. Unfortunately cyber security proves to be conversely proportional to the business volume.

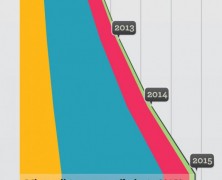
The Rise Of Tablets
visualized by: Skyrocket
Tablets are replacing time spent with desktops and laptops and that only stands a good reason for the Tablet burst.
The internet tomorro...
visualized by: Cisco
It’s not the future. It’s the “Tomorrow” and it’s gonna be big, really BIG. Introducing the Zettabyte and the Video blast.
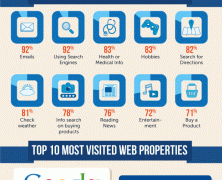
How People Spend The...
visualized by: go-gulf.com
A holistic overview on the time we dedicate for online activities, the most popular activities by frequency and time spent and the 10 most visited web properties.