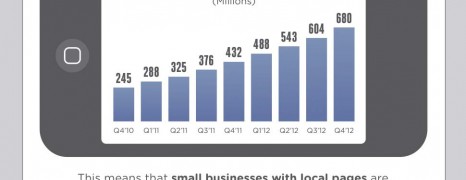
As Facebook gradually rolls out its brand new search bomb backed from Bing, online marketeres are plausibly pondering about the impact of Graph Search on small businesses that are unable to compete on social ad spending with big brands. According to this presentation, social search is going to accent local businesses against big brands. Do you agree?
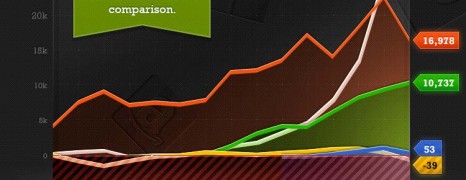
Tech Companies Profits 2012
visualized by: Staff.com
Five of the most popular tech giants (Apple, Microsoft, Amazon, Google, Facebook) are contesting in a dollar runrace. See how they have performed historically till 2012 as for revenue, profit and market caps.

Facebook Button Ideas
visualized by: TheMapleKind.com
Do you feel like hitting your head on the wall when you read your facebook wall? Who doesn’t? Here are some suggestions for complementary buttons that may help us survive from the foolish updates. Just think the power in your hands with a “I don’t care” button!
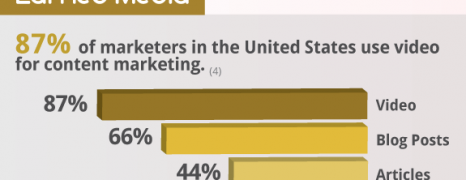
Mobile Video Future
visualized by: uberflip.com
Video sharing sites are sprouting everywhere and users are getting more and more engaged. In conjuction with the rapid growth and adoption of smart mobile devices, the only question left is about how big is gonna be the mobile video trend and further what will be the scale of sharing as part of the social media activity.
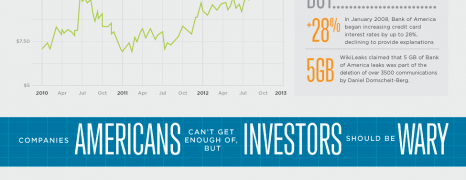
Good and Bad Companies
visualized by: nowsourcing.com
See the 3 companies that Americans love but investors look with a frown face against the ones that investors find good to put their money on but Americans have reasons to be wary.
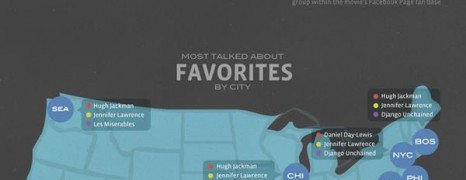
Oscars 2013 on Facebook
visualized by: Doctor Who?
Oscars lights are off now but it would be interesting to see the films and artists that moved facebook users and created the most social buzz before the ceremony opening.
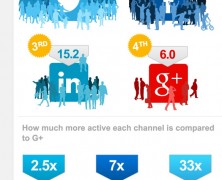
Google Plus Vanity
visualized by: UMPF.co.uk
Since the initial spurt right after its launch, Google plus has shown reasonable growth and has been well accepted by several robust brands. But according to this social activity breakdown report for Facebook, LinkedIn, Twitter and G+, it seems that the latter falls behind in user engagement.
The Facebook Ipo
visualized by: Quin Street
Really big numbers. Mr. Zuck’s majesty worths more than you can imagine and will keep rising.
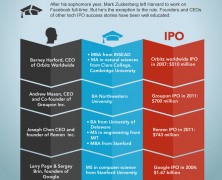
The History Of Facebook’s Developer Platform
visualized by: Nick Sigler
The treasure of Facebook apps. It all started in 07 with a 65 developers flock and now emploies 232K people yielding 15.3 KKK in the EU economy.

Social Commerce Trends 2013
visualized by: 8thBridge.com
What’s the next step after settling social presence for an online retail business? According to this report social commerce leaders have set the path to the direction of social shopping features integration as part of an e-commerce site’s funcitonality.
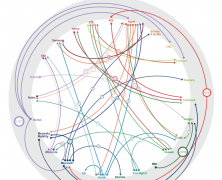
The Patent Wars
visualized by: Visual.ly
And the battle begins! See here a really complicated diagram of the backstage relations among the top tech companies.
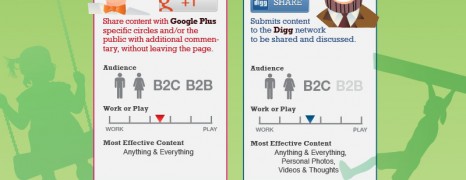
Social Sharing Button Playground
visualized by: The seach agency
Social traffic is a hard game with many options. See here a quick evaluation of the most popular social sharing platforms that can help you strategize your marketing channel mix.
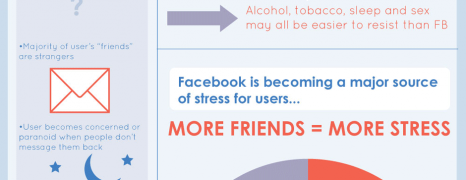
Facebook Addiction Fact Or Fad
visualized by: Doctor Who?
Find out how big our social media problem is, why is there and signs and facts of addiction. Like?
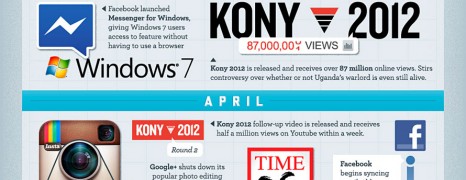
Social Media Highlights 2012
visualized by: AddThis.com
A nice recap of social media activity for 2012 as collected and grouped from Addthis, including highlights for service growth, celebrities’ and movies popularity, top buzz tech words and most shared events.
The State Of Social Media 2012
visualized by: Seo Company
Social media have been utilized for various purposes from private and business activities to politics and activism. Here are some highlights for 2012.
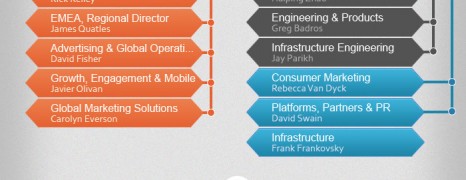
Facebook and Google Structure
visualized by: Graphs.net
Meet the white collars of the two internet giants. A graphical representation of Facebook and Google company hierachy structure depicting the the roles, departments and relations.
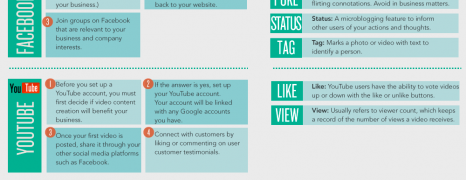
The Small Business Social Media Cheat Sheet
visualized by: Flowtown
An overview of the most popular social platforms on a cheat sheet with pros,cons and how-to’s. It’s time you come out!
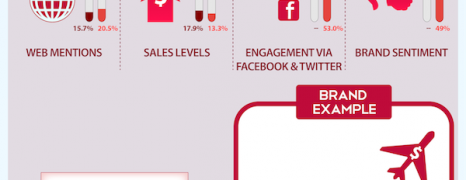
The Social Media Lifecycle
visualized by: uberVU
A look into 4 pillars that will get you deeper in understanding your brand’s social media lifecycle. Monitor, Analyze, Engage, Integrate.
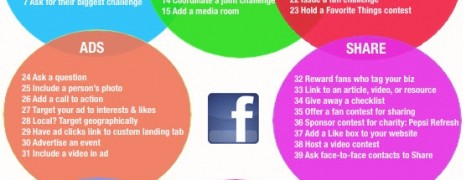
Facebook Marketing Strategies
visualized by: Social Media Online Classes
64 recomendations grouped in 8 sections that can help you plot a marketing strategy on Facebook.
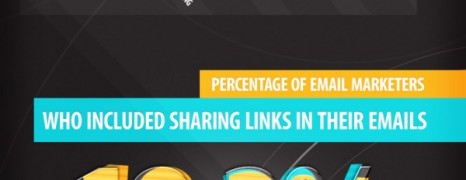
Email Marketing and Social Networking
visualized by: GetResponse.com
Discover the power in your hands when you combine traditional Email marketing channel with Social Networking mechanics. Strictly for online marketers.