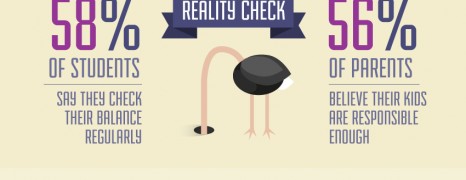
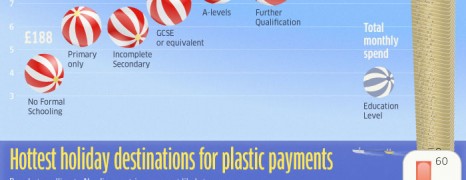
An insight into what students say they spend a month compared to what their parents say they think their children spend per month
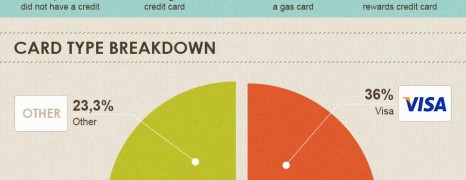
US Credit Card Ownership
visualized by: Mydebt24
According to this report credit card ownership rate for the Americans is about 1:3,5 with a whopping total of 1,5 billion cards in circulation. On average, at early 20’s is the time when a person enters the plastic world.
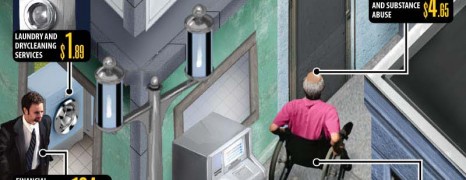
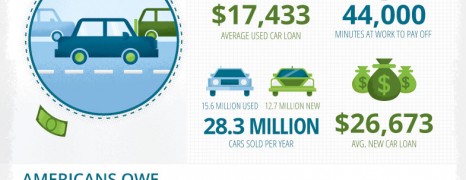
American Spending Trends
visualized by: CreditLoan.com
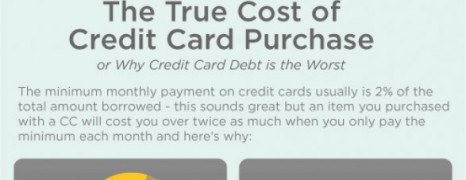
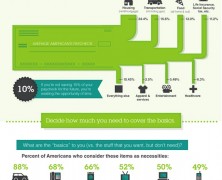
The average American is over $8,000 in debt, which is up dramatically from a whopping $48 in the 1940s! See a breakdown of Americans’ average monthly spending across the various product and service categories and get an idea of the average debt burden due to uncovered overspending.
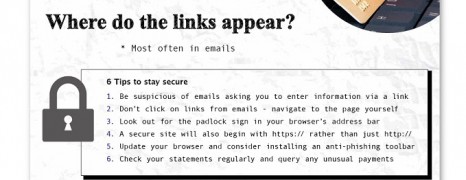
Credit Card Scam Protection
visualized by: Neo Mammalian Studios
At £341 millions is estimated the total loss for UK banks due to credit card scams in 2011. As banks and credit card networks are striving to develop even more advanced methods for fraud prevention, so do swindlers manage to find new techniques to break the shield. Learn about the most common scam methods and how to secure your digital pocket.
Improve Credit Score
visualized by: Neo Mammalian Studios
Plastic money is convenient but it might turn out overwhelming. Using your credit cards wisely can save you from interest charges, help you to better allocate your debt and smartly boost your credit rating. See how it works.
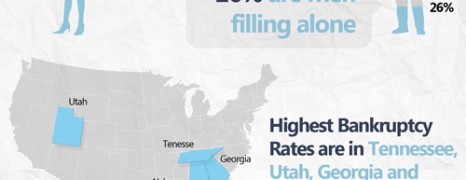
American Bankruptcy 2012
visualized by: Low Price Law
This report from Low Price Law outlines the situation with bankruptcy status of American families or singles and hightlights the reasons that lead to bankruptcy filing. However, a comparison between 2 annual periods of 2011 and 2012 allows some optimism.
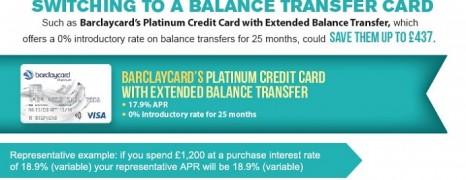
Credit Card Use UK
visualized by: Tesco Bank
Tesco Bank reports on the way people use their credit cards in the UK and found some surprising results. This infographic is a great way to see how credit card use reflects who they are and what stage in their life’s they are going through.
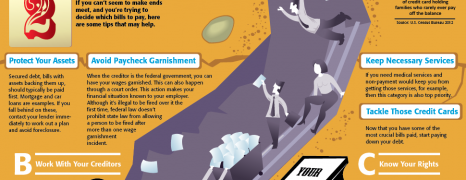
Living Without Mortgage
visualized by: Beckon Media
The concept for this infographic is to show the positive financial impact of living without your mortgage for a year. You will see the major causes of consumer debt as well as price in working hours needed to pay off each debt.
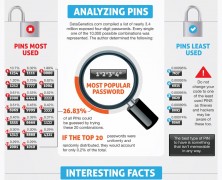
PIN Security
visualized by: Background Check
Although a four digit PIN can seem like a little detail in the scheme of things, it can play major role in your financial security. Why do we use PINs and could someone guess yours? Find the thurh.
Dig Yourself Out Of Debt
visualized by: Credit Donkey
Are you wobbling with your personal finance? Read this helpful guide and start reconciling before going down the drain.
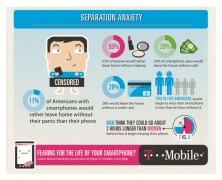
Mobile Seperation
visualized by: T Mobile
1 in 10 Americans would rather leave home without pants than their smartphone. Read some interesting facts as far our addiction to routine habits.
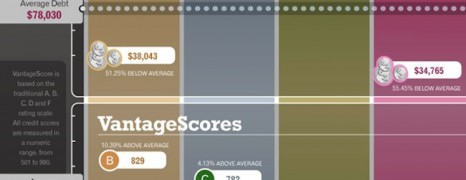
Generations’ Credit Profile
visualized by: Experian
Generations seem to share on more gap. The credit gap! That is the differences in debt source and debt volume determined by their life-phase needs and wills.
How Interest Rates Work
visualized by: Kiboo
Self explanatory. À handy guide on banking finance simplified for non economists.
Money evolution time...
visualized by: INTUIT
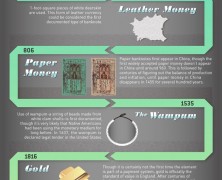
From the times we bartered meat with eggs till the digital age that we have plenty options to pay for goods we want. This is the monetary history of the world’s economy.
Social Oversharing and Security
visualized by: Quin Street
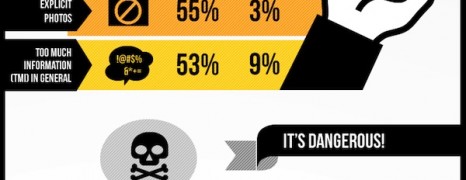
Have you ever wondered if we are overdoing it with social sharing? Security issues might come up when you thoughtlessly update your status. After all, oversharing is strongly related with emotional disorders.
Keep some things private and know if you are suffering from FOMO – the social media syndrom of our days.
Balancing Your Perso...
visualized by: LifeTuner
Try always to be on the safe side. Defeat greed, trig up and control your cashflow. Things can go better if you reconsider your “basic” needs. Forget that magic plastic card.