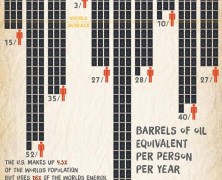
Humans are consuming the resources of 1,5 Earths to satisfy their needs and support their lifestyle. Have a look at how we exhaust natural resources while generating thousands of tones of waste.
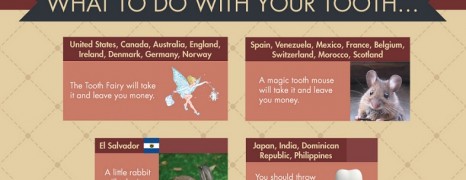
White Lies Parents Say
visualized by: Neo Mammalian Studios
Depending on the country you grew up in, you have probably heard some of these little white lies from your parents’ mouths.

Where to Pee
visualized by: Neo Mammalian Studios
A rather wacky infographic in the wake of one more insane World sth. Day. 19th November is the world toilet day! OMG. Next year celebrate the day at any of the following best for pee places around the world.

Sunsets Around the World
visualized by: Neo Mammalian Studios
Check out this photo compilation of enchanting sunsets from 24 of the most popular cities around the world and travel with your mind.

All About Spices
visualized by: Graphs.net
Do you like it hot? Spices can heat up your inner causing a pleasant and uplifting feeling. But how much can you handle before you get burnt down.
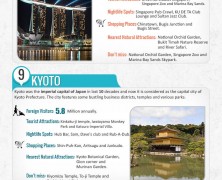
Destination Asia
visualized by: Graphs.net
What to choose from an immense continent with 49 countries like Asia? This inclusive travel guide presents 16 of the most popular places to visit across Asia based on solid travelers’ reviews.
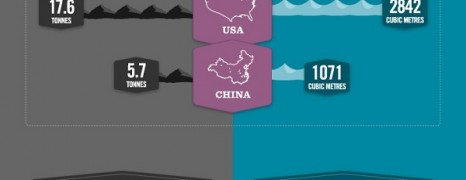
Carbon Footprint vs Water Footprint
visualized by: Neo Mammalian Studios
Reducing our carbon and water footprints could help us save money but above all Earth. Learn how water and carbon footprint is assessed, what is the average per capita carbon emission and water consumption in UK, USA and China and what we can do to better control the situation.

Immigrant Entrepreneurship in US
visualized by: Kauffman.org
According to this report high-tech startups from immigrants in the US are getting slack showing signals of sliding from 2005 to 2012. However, there are some exceptions to the trend.
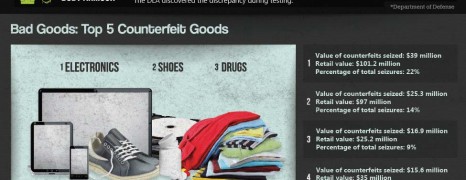
Fighting Counterfeiting
visualized by: Camcode.com
The value of global counterfeit goods is expected to reach around $1.7 trillion within the next 2 coming years, representing more than 2% of the total economic output according to international chamber of commerce. Learn about the impact of illicit trade on economy and society.
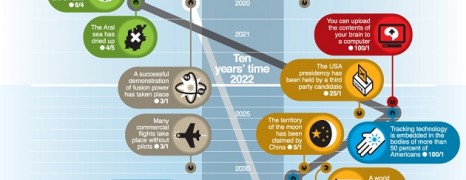
Future World Predictions
visualized by: InformationIsBeautiful.net
Wabbling between realism, envision and utopia, here you will see a 100 year timeline ahead our times refering to predictions about various aspects of our life in the future world.
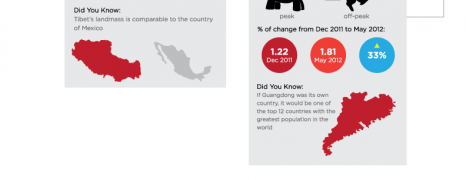
China Broadband Speed
visualized by: ChinaCache.com
Notwithstanding the dashing economical development, China’s broadband infrastructure seems to snail compared to the established standards. Shangai primes the speed rank, at 5.96 Mb/s on average and 6.3 max during off-peak hours. However, advancements have been done since 2011.
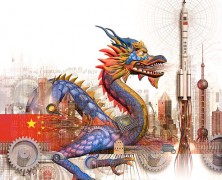
China is Changing
visualized by: Guardian.co.uk
Interactive infographic that represents various advancements happened in China since 2002 and the ongoing changing in business world , lifestlyle and culture. The new China will soon inaugurate Xi Jinping as its governor for the next decade.
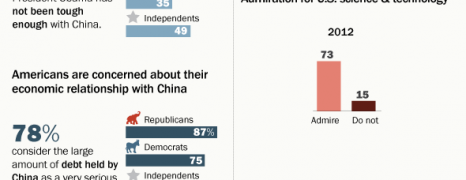
China American Relationship
visualized by: Doctor Who?
The hard riding Chinese economy invokes constant change in the relationship betweeen China and America and consequently in the global opinion for each of these countries. It’s not about hatred or love but something in between. See how Americans and Chineses see each other.
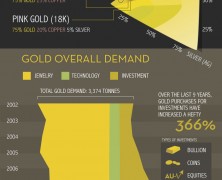
Gold Uses Today
visualized by: VisualCapitalist.com
Here is the 3rd part of the gold series, that outlines its 3 major uses in modern times. You will also learn how world demand is allocated across countries and how it’s connected to strong economic growth.
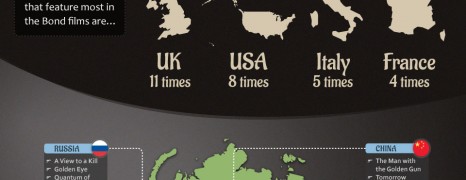
James Bond Travel Destinations
visualized by: Wanderforth
If you are planning to tour all around the world then make it like a Bond. Here you’ll see the James Bond travel itinerary and mileage throughout his film history illustrated by Wanderforth. These guys are promising to make your dream come true. Are you ready to go?
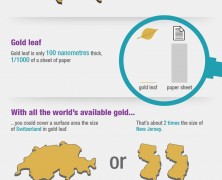
Facts About Gold
visualized by: TrustableGold.com
Fascinating insights about the world’s most famous precious metal.
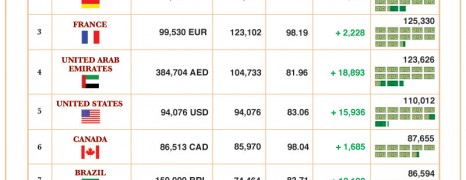
Attorney Salary Trends
visualized by: Maximilian Bode
A look over the average attorney salaries in 14 countries around the world along with analogic comparison against living cost in New York. More info less graphic but it’s ok if you are in the law tribe.
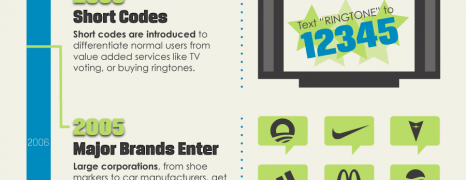
Mobile Phones in Marketing
visualized by: Doctor Who?
Have a quick view on the timeline of mobile technology evolution and the utilization in marketing with milestones starting from its infancy in 19th and 20th century.

China Communist Party
visualized by: Adolfo Arranz
A great interactive infographic (though built in flash) about the communist empire in China depicting its structure and the established statism along some bios of brass hat members.
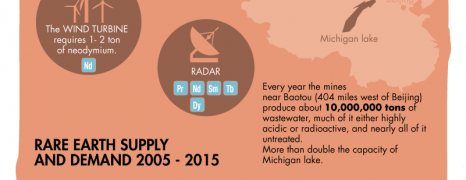
Rare Earth Metals industry
visualized by: Buckyballs
They sound valuable due to scarcity but that’s not truth. Rare metals are feeding the high-tech blossom. Now it’s obvious how the story goes…