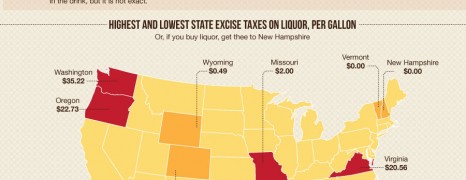
Do you have any idea of how much we shell out on taxes for pleasure products like alcohol, cigarettes, gambling and marijuana? Let’s see how much we would save from tax excise if government was less greedy with our pocket and learn from the the tax history in the US.
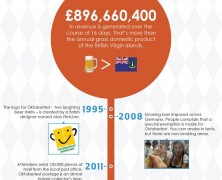
Oktoberfest History
visualized by: Neo Mammalian Studios
In the wake of the 180th celebration of Oktoberfest, this infographic comes to summarize the historical highlights of the most popular festivity of German culture and tradition.
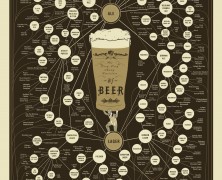
Beer Varieties Chart
visualized by: Doctor Who?
Fan of the lager or the ale school? Or maybe both. Find here a break down of the numerous beer variations.
Making Beer
visualized by: B.G. Seielstad
Well this looks more like blueprint rather than infographic. However, it adequately outlines the process of making beer and we think it legitimately represents primary stage of the modern infographic ideation.
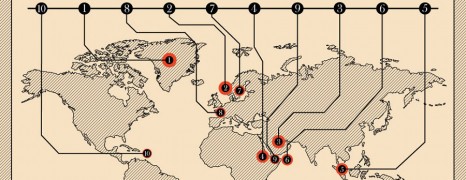
Beer Price Worldwide
visualized by: Travelsupermarket.com
Learn where on earth you’ll find the highest and lowest prices for one pint of beer. If beer drinking is routine habit of your hangouts while on a foreign ground, you need some budget planning.
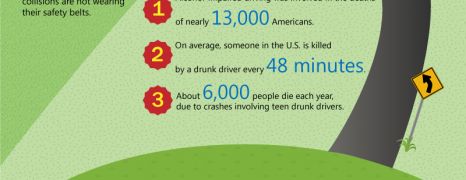
Drunk Driver Fatalities
visualized by: Marto Apostolov
Here is a report that rings the bell to drivers who drink and drive under alchol influence instead of safely planning their home return. Drunk driving accounts for 1/3 of all traffic fatalities and beer is the most common beverage involved in crashes.
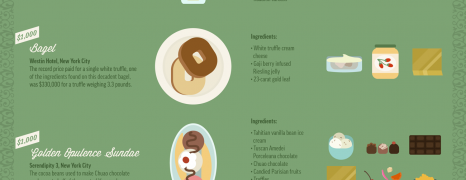
Worlds Most Expensive Dishes
visualized by: Dishpal.com
Could you indulge yourself with these luxuries? Some of them belong to typical and popular meals but all of the are made of top quality ingedients.