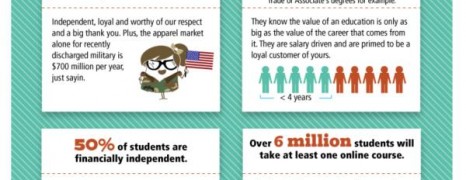
Sheer ID comes back profiling the complexity of the college student crowd in 2012 to help marketers reconsider their targeting efforts.
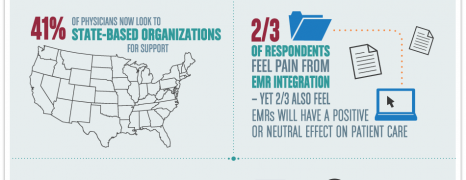
2012 National Physicians Survey
visualized by: TheLittleBlueBook.com
This survey examines the impact of change on physicians and their practices.
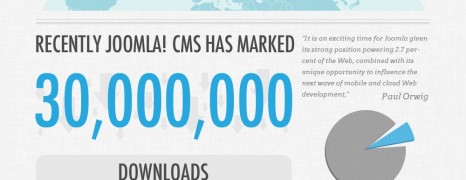
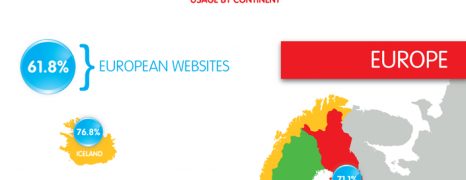
Joomla Stats 2006-2012
visualized by: Doctor Who?
Some statistics about the market share and efficiency of one of the most popular CMS platforms.
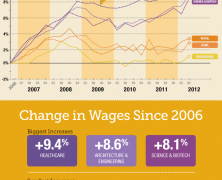
Best Paid Jobs 2012
visualized by: PayScale
Payscale gives us on more interesting study about the wage growth of jobs in six basic industries over time.
Compensation Survey 2012
visualized by: PayScale
This is a market pricing practices survey and asks employers about their current compensation practices and any planned changes. Figures are from 2011 and are compared to 2010 with a split by company size and industry.
Cannes Lions 20 June 2012
visualized by: SapientNitro
The buzz created on the 3rd day of the Cannes creative media festival including some fun facts, collective statistics, winning trends and award statistics. See also the crowning of “the media person of the year”
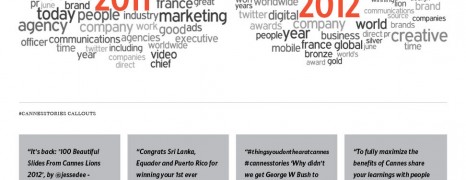
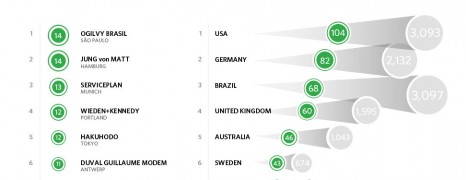
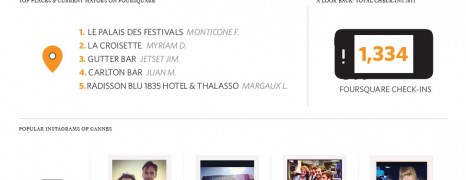
Cannes Lions 2012 Recap
visualized by: SapientNitro
The week overview of the most creative festival in Cannes. The hottest topics, the top tweeting coutnries, the buzz-iest days & hours and more.
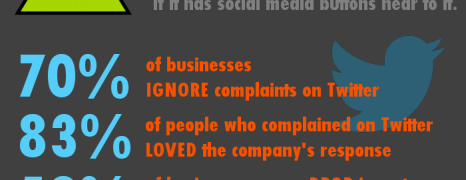
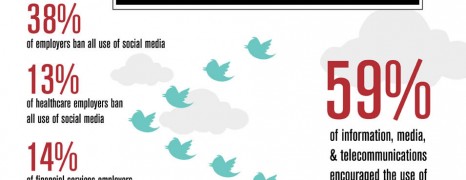
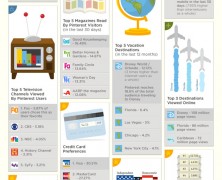
Twitter For Business 2012
visualized by: webpresence.tv
Well, ok – this is not the best infoGRAPHIC in terms of styling. But it worths to read these twitter stats from the business point of view.
Very Pinteresting
visualized by: Modea
It’s the new kid on the block and it’s thriving! Pinterest is more than a female favourite social network. This report displays insights on the lifestyle anf behavior of P users
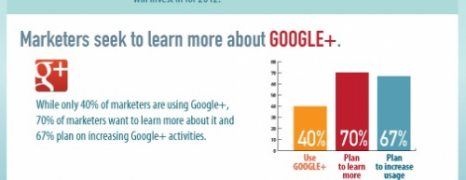
Social Media Marketing Report 2012
visualized by: Patricia Redsicker
3800 marketers declare their views and concerns over the current state of social media channels. All of them agree about the value for their busines but almost the half is still seeking advice on ROI measurement and targeting. If you are in this field then it’s a must-read classic report.
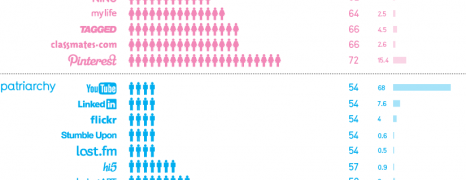
Social Media Gender Split 2012
visualized by: David McCandless
Ok Pinterest is extremely popular to women – we know it. But what’s the pie split among the other social media networks? Social bookmarking sites aren’t women’s preference.
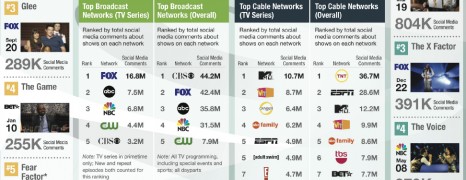
Tv Show Social Buzz 2012
visualized by: Blue Fin Labs
See which tv shows and series from the top US networks skyrocket in the social activity.
Google Analytics Users 2012
visualized by: TargetOnlineMarketing.com
A worlwide market share analysis of the most popular website metric platform. The G domination once more.

Cannes Lions 19 June...
visualized by: SapientNitro
The second day recap of the great advertising festival including awards stastistics.
Cannes Lions 18 June 2012
visualized by: SapientNitro
The first day of the Cannes Lions 2012 – the greatest creative media festival. Here you will find the agencies by country, a partial festival’s timeline from 1992 and some buzz figures for the opening day.
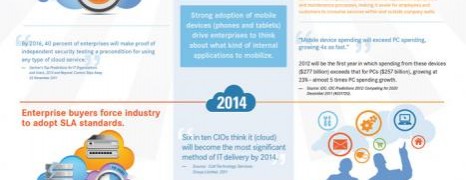
Cloud Impact And Adoption 2012-2015
visualized by: Axway
Predictions about the impact and adoption of cloud services for software vendors and enterprise IT.
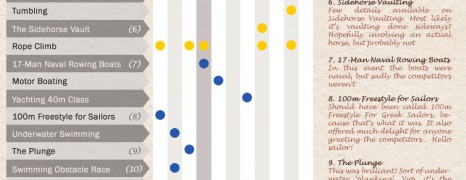
50 abolished Olympic Events
visualized by: findmeagift.com
From experimentation and innovation to the spectacular sport fiesta. Learn about 50 olympic events that have been taken out the olympic frame since the official start in Athens 1896.
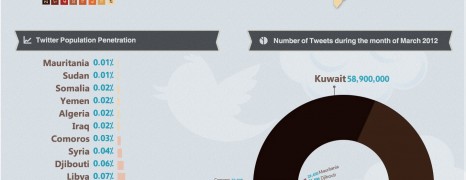
Twitter Users In the Arab World
visualized by: Lama Zaitoon
A quick review over the twitter expansion among users in the Arab countries.
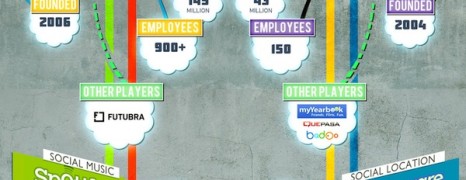
Social Media Leaders 2012
visualized by: Social Jumpstart
The inexorable battle of the social domination. And the oscar goew to….
")