You don’t have to be an artist to be creative. We were all born to be creative. This infographic tells us more.

Biggest Hoaxes in History
visualized by: Best Psychology Degrees
Discover 10 of the biggest hoaxes in history that have successfully catch on the common sense either with semi-truth or even totally fake yet sophistic stories.
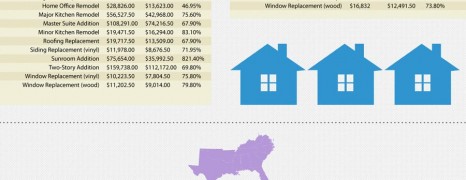
Home Remodeling Cost vs Value
visualized by: BRIM Agency
How much value could a home remodeling project add up to a property in the US ? Here you see comparison tables for average cost and resale value on national and regional scale based on prices of 2013.
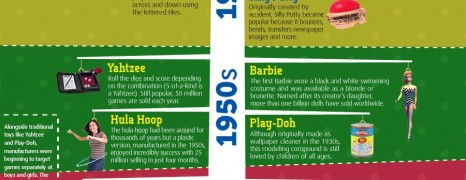
50 Most Popular Christmas Toys
visualized by: Cash Generator
Enjoy a retrospective of the most popular Christmas toys of the last century and realize how technology has transformed the way children entertain themselves as well as the big shift on kids’ Christmas wishlists
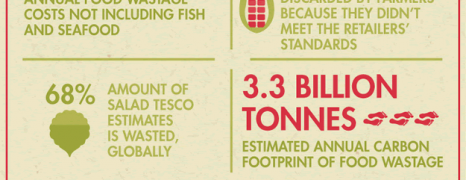
Food Wastage in UK
visualized by: Neo Mammalian Studios
British consumers leave tonnes of food on their plates every year. Food wastage has evolved to a critical issue for developed countries like UK and a paradox for countries where people are below the breadline and are starving to death. What can we do to change this?
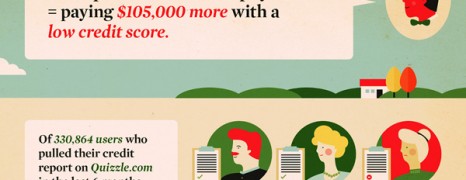
Consequences of Low Credit Score
visualized by: Ghergich&Co
Ignoring your credit score could bring you against unbearable costs. Have a look at the consequences that result from overlooking regular credit score review.
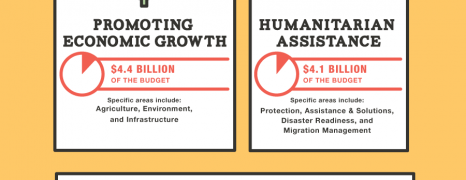
US Foreign Aid 2012
visualized by: nowsourcing.com
Does the US government offer substantial financial aid and support to the “weak” or just throw crumbs to whitewash its image and manipulate nations ? See a breakdown of the US foreign aid as of 2012 and how it stacks up against the total U.S. budget.
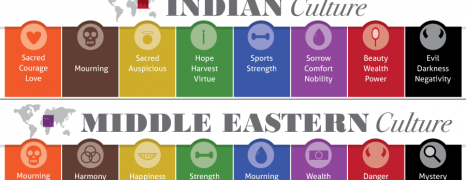
Color Perception by Culture
visualized by: nowsourcing.com
Color has long be used to implicitly or explicitly transmit and communicate ideas or messages. But do we all receive the same signals regardless of our origin and beliefs ? This chart puts color on the map and presents color perception among various cultures and religions.
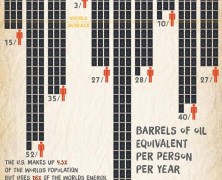
Eco Footprint 2013
visualized by: EricPhillips.net
Humans are consuming the resources of 1,5 Earths to satisfy their needs and support their lifestyle. Have a look at how we exhaust natural resources while generating thousands of tones of waste.
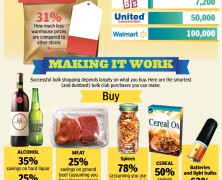
Bulk Shopping Tips
visualized by: Cheap Online Degrees
This infographic sheds some light on the ins and outs of bulk shopping in an effort to draw some conclusions about the final benefit.
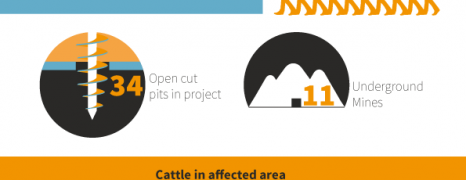
Biggest Australian Coal Mine
visualized by: Neo Mammalian Studios
With 11 underground mines, the Kevin’s Corner massive complex located in Queensland of Australia will change the area now occupied by the Galilee Basin forever.
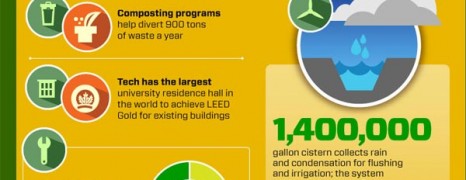
10 Greenest Campuses in US
visualized by: Best College Reviews
Quite self-explanatory, on this graphic you will find 10 of the most revolutionary campuses across the US that have embraced green practices and technologies as for waste reduction, facilities, renewable energy etc.
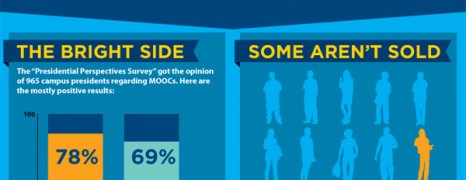
Higher Education Moocs 101
visualized by: Online PhD programs
Are you familiar with the MOOCs? That is Massive Open Online Courses and the term mostly refers to higher education. Learn about the basics and the buzz that there’s been around lately.

Associate Degree Jobs
visualized by: DegreeQuery.com
Are you wavering between 2 or 4 years of studies when you reckon with your wallet? No reason to worry. Holding an associate degree after 2 years studying, you can land a job with a decent or even above the average paycheck. Check which are the best and how they are paying off.
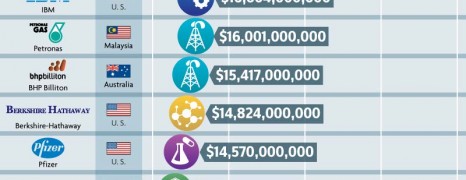
Most Profitable Companies 2012
visualized by: Accounting School Guide
Contrary to the unstable economic context, there are evident signs of companies from all around the world hoarding. Here you see 25 of the most profitable companies worldwide as of 2012 and following to that 6 American companies that “missed” the taxation path.

RDS vs EGWP
visualized by: EGWPInfo.com
RDS stands for Retiree Drug Subsidy while EGWP for Employer Group Waiver Plans. EGWP have a number of tax and administrative benefits that plan sponsors and brokers cannot ignore. This infographic explores the major differences in plan options for retiree pharmacy benefit plans.
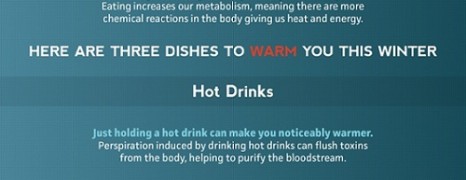
How to Stay Warm in Winter
visualized by: Neo Mammalian Studios
You don’t have to be cold this winter. Find out how you can stay warm and what are the risks of exposing yourself to severe cold conditions.
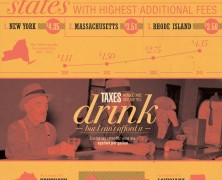
Taxes on Vices
visualized by: nowsourcing.com
The government seems to delight in taxing the vices of it’s people. Anyone who buys alcohol or smokes cigarettes can attest to that. This infographic looks at sin taxes across the nation.
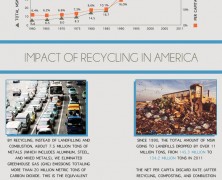
American Trash
visualized by: KickStart Search
Americans seem to have done much as far as recycling is concerned. This graphic presents the amount of trash produced, the percentage of waste recycled, and the impact of recycling in America since the 1960?s.
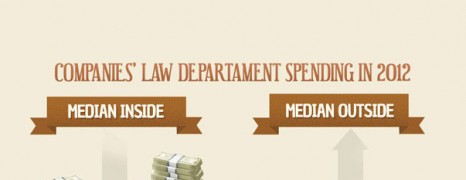
Business Attorney Cost
visualized by: UpCounsel
On this infographic you’ll find information about why attorney cost for business cases is particularly high and how attorneys’ fee is made up. Additionally, you can get an idea of average spending for the most common legal services requested by small businesses, as well as of salary variation based on specific location across the US.
")