
Are you looking for the top cream in higher education? Have a look at the top 10 universities with an average tuition cost idea according to QS university rankings.
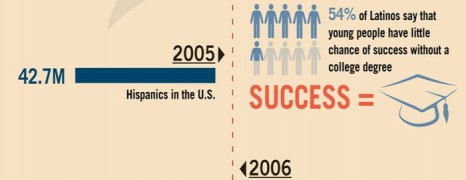
Latino Education in the US
visualized by: NHU.edu
Hispanics account for roughly 17% of the US population and are a fast growing body. Here is a breakdown of how they perform in higher education.
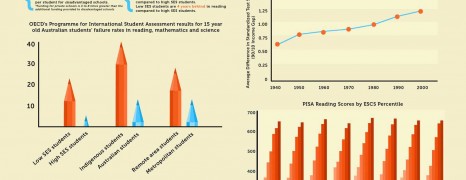
Economic Status and Educational Achievement
visualized by: Andrianes Pinantoan
Interesting insights about the way that social, economic and cultural status affect the performance and achievements of students internationally.
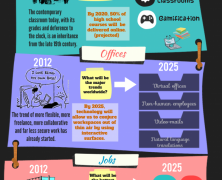
The Future Labor
visualized by: Quib.ly
Are our education systems capable of preparing the workforce of the future? Where are labor relationships heading? Discover some interesting thoughts on conception gaps that technological evolution brings in.
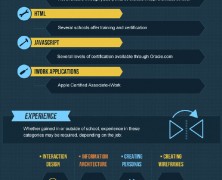
Career in UXD
visualized by: Quin Street
Thrilled by designing products or services that people will love and use? Here you get an idea of what it takes to make a career in UXD (User Experience Design) and how much you’ll earn on average.
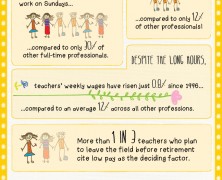
Teachers Are Heroes
visualized by: Lemonwood Design
Teachers change the world by spreading knowledge. Do you think they receive equivalent value?
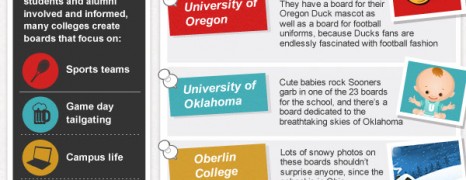
Pinterest in Education
visualized by: Quin Street
Aside its smash on the mainstream users, Pinterest gains ground in education circles. See how professors, teachers, students and colleges utilize pinboards to promote creativity and exchange ideas.
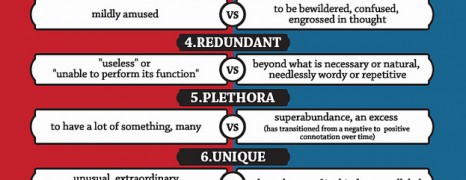
10 Tricky English Words
visualized by: Grammar.net
Find here 10 not common yet tricky English words whose meaning is often misconceived. Let’s say “bemused”. What do you have in mind?
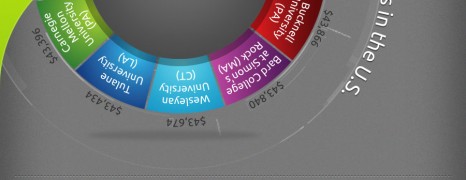
Bachelor Degree Cost Comparison
visualized by: Graphs.net
Learn about the average cost of a bachelor degree in various countries around the globe. Discover the most expensive private colleges in the US, the most high paid majors and finally the degrees with the lowest earnings on return proportionally their cost.
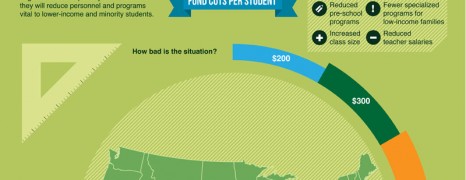
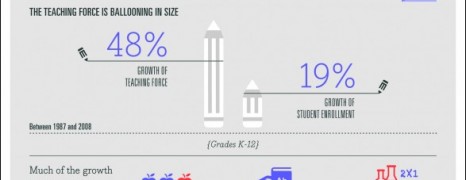
Public School Crisis in America
visualized by: onlineuniversities.com
This graph outlines the situation in public American schools that results from budget deprivation for the educational system and the correlative effects on the society. Though there’s a growing body referring to educational crisis, Americans still have faith in their neighborhood schools.
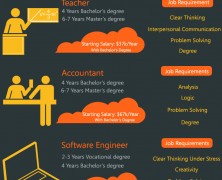
Job Market Turnover
visualized by: Linda Watson
Get informed about estimations for the job market turnover in the next five years. According to specialists a high demand for online education and online degrees is expected making the following five jobs sought after.
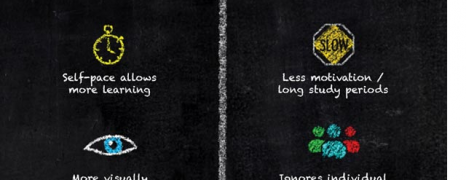
Online vs Classroom Education
visualized by: IdriveSafely.com
The majority of academic leaders believe that online education is equal and likely superior to classroom education. Could you find the base to justify that?

Food Idioms English
visualized by: Grammar.net
English lesson No 10. Talk before eat them. 10 popular and “tasty” food related idioms to turn your listener’s appetite on.
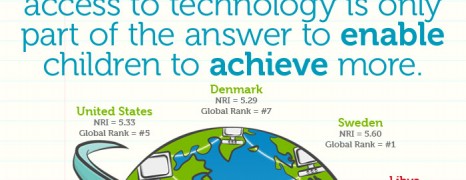
Bridge the Digital Gap
visualized by: Dell
The student’s and educator’s are facing some challenges, issues while accessing technology. This infographic outlines some of the challenges from students and educator’s both and looks at potential solution to the critical issues.
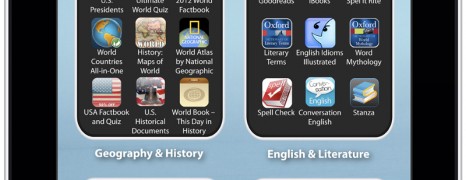
Best Mobile Learning Apps
visualized by: onlineuniversities.com
All about learning on the go. A tablet layout presentation of the most intriguing iOS mobile apps you can use for brain-training, memory retention, general and special knowledge or just for improving productivity.
New Teachers Statistics
visualized by: GSE.upenn.edu
This report examines the significant growth of the US education workforce that resulted from the change in the analogy between experienced and new teachers.

US Student Loan Statistics
visualized by: OnlineSchools.org
The majority of graduates from 4 year colleges are on the thin end of the wedge as far their debt management. This report shows average student expenses estimations and breaks down the situation in the student loan landscape.
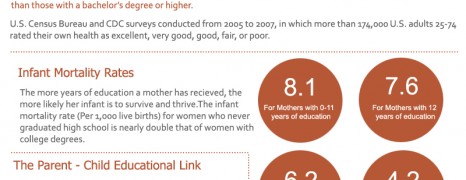
Education and Lifestyle
visualized by: Education Requirements
This report outlines how better educational qualification affects life quality in terms of health, life expectancy and earnings.
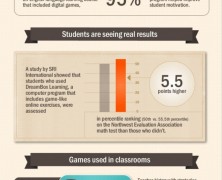
Games in Education
visualized by: Quin Street
OnlineSchools.com present a great infographic about the benefits of implementing game-playing activities in education takiing advantage of new media. Learning rocks when comes through fun.
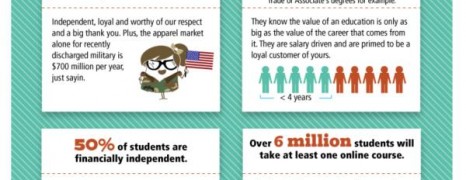
College Students 2012
visualized by: SheerID.com
Sheer ID comes back profiling the complexity of the college student crowd in 2012 to help marketers reconsider their targeting efforts.
")