
What makes even more employees of the Generation X and down demographic to return to college? Is this incidental or a trend? Would an improvement of educational background bring in the expected results in career boosting and salary? Read the data.

Weird Master Degrees
visualized by: graduatedegreeprogram.net
Awarded Masters total at 688,000 in the US. Aside the most popular ones, there are some of the most unusual that would make your eyes blinking. Let’s say Masters in Meat Science.

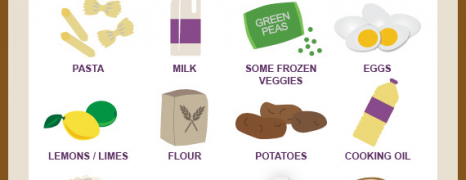
Exam Nutrition Tips
visualized by: Graphs.net
From breakfast to dinner, this is all about why students should tap into high quality nutrition during exam period and how they can make the right ingredient and food mix that will maximize their performance.
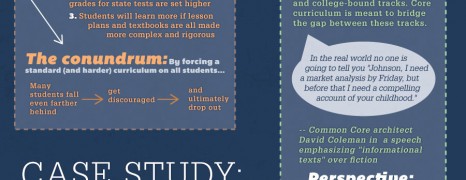
Core Curriculum of America
visualized by: Best College Reviews
Most educational experts agree that common core curriculum is not the solution to closing the achievement gap. Read some stats here.
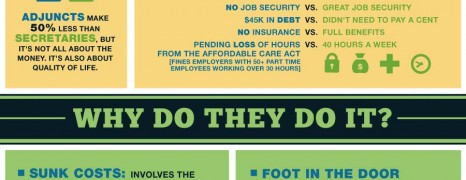
Adjunct Professor USA
visualized by: Online PhD programs
As much as 76% of faculty employed in American colleges and universities are now part-time workers on limited term contracts. This graphic gets down to the American universities’ adjunct crisis.
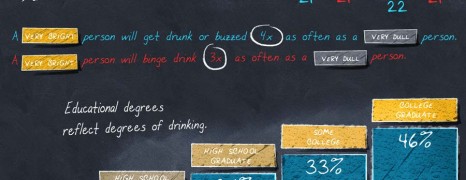
IQ and Alcohol Consumption
visualized by: BestMastersDegrees
According to a number of studies childhood intelligence and alcohol consumption inclination during adulthood are directly correlated .
The findings indicate that it is intelligence itself that influences alcohol consumption, not all the things that accompany intelligence.
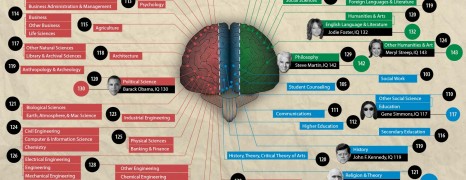
IQ by College Major
visualized by: Bachelor of Education
Did you know that your college major preference says a lot about your brain and specifically your IQ? This graphic shows some of the most common majors with the average graduates’ IQ attached and grouped by the hemisphere side they mostly relate to.
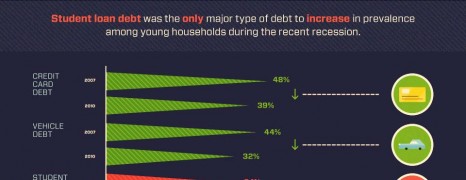
US Student Loan Debt Crisis
visualized by: Ghergich&Co
Student loan debt in the US has gone 4X up since 2003 and banks seem to be determined to keep leeching students and likewise their families. Outstanding debt has evolved to a flap and lower to middle income households are in despair. See a breakdown of banking on education with historical data.
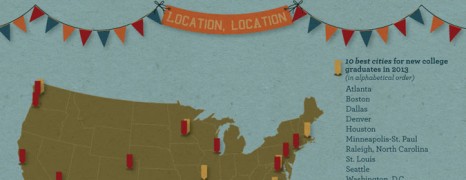
College Grads 2013 Potentials
visualized by: nowsourcing.com
People from Sparefoot report on the plans and employment opportunities of the fresh 2013 Grads’ Class. According to this report, roughly 900,000 graduates will move to a new apartment and most of them to a new city in pursuit of a job. But which are the most job promising cities across the US?
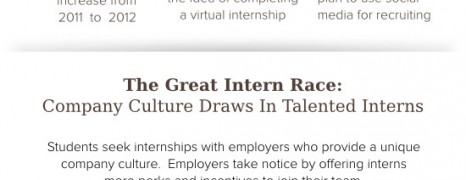
Internship History
visualized by: Shamgar-Tracts.com
Internship has its roots to apprenticeship back in 11th century, a system built to make skilled workers meet with inexperienced ones and diffuse knowledge. Have a look at the background of internship and how it has entered the mainstream of today student and business life.
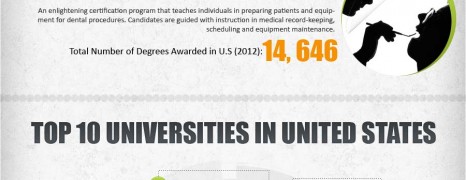
Top Ranking American Certificate Degrees
visualized by: Graphs.net
Find 10 of the most popular certificate degrees in American education system ranked by attendance as of 2012. Read on to see 10 of the best US universities and the most sought after courses.
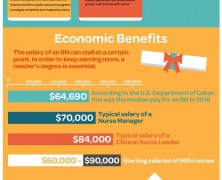
Mastering in Nursing
visualized by: USF's Online MSN
Interested in pursuing higher education in nursing? This report presents 8 specializations in nursing one can choose with an MSN (Master’s in Nursing), the career opportunities that emerge and the involved economic benefit from notable increase in paychecks.
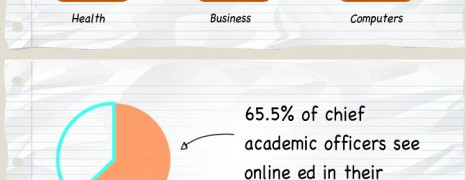
Online Education Growing
visualized by: James Parsons
A quite simple and minimal infographic that depicts the significant increase of online schooling. During the period 2005-2010 online students have doubled. What holds the future for education?
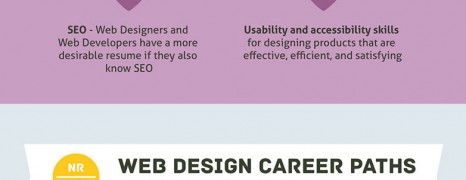
Web Designer Education
visualized by: Mostash
Are you heading for a web designer career? If you find yourself swinging between self taught or formal education this report may help you decide. Get an idea about the qualifications you need to work as a web designer, the options you have for a career path and the average money you will earn in the US.
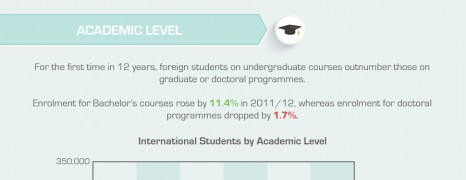
Foreign Students in US
visualized by: Neomam
China, India and South Korea are the leading student exporters to the US while University of Southern California, University of Illinois and New York University are preceding in international students’ preferences. Get more info about how the foreign student body in the US breaks down.
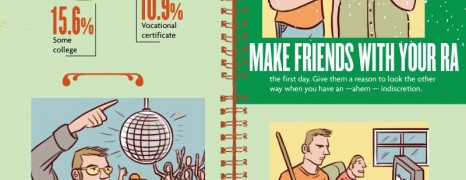
First Time Student Tips
visualized by: TopCollegesOnline.org
Student life has its ups and downs and is actually a mid-phase for transition to the cruelty of the real life. This 21 all-inclusive guide gives some practical tips to help students have a good start with the best chances of achieving their educational goals.
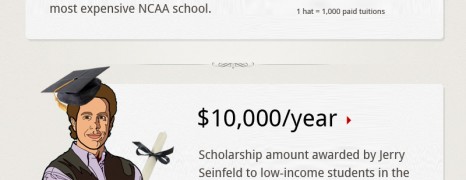
American Scholarships
visualized by: James Parsons
3.4 billion dollars are available via scholarship programs to students across America , and this infographic breaks down where they are coming from.
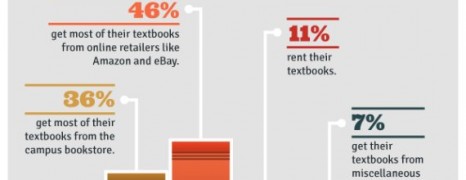
College Students Economics
visualized by: Doctor Who?
No doubt the tuition is lion’s share of student life cost but there are several other expenses one should consider and manage during that time to avoid get pinched. Find some money-saving tips that can yield you bucks from rent, food, books, transportation or entertainment.
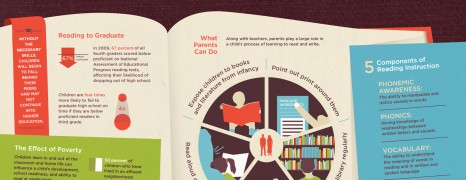
Learn Children Read
visualized by: Good.com
This infographic spotlights the importance of learning children to read adequately till the 3rd grade as the basis for progressing and successfully completing high school education.
Student Living Essentials
visualized by: Stumble
A friendly guide for the new comers in student life with 4 cards that refer to best practices and tips for accomodation, nutrition, fun and finance.
")