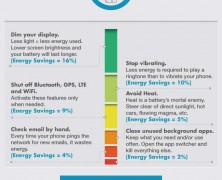
Extending the life of your batteries can be really easy with the right advices. Take a look!

Teenage Driver Facts
visualized by: Safer America
This infographic on teen driving safety talks about the most dangerous times for teenagers to drive, provides some staggering statistics, suggests tactics for parents to use in educating their children on driving safety, and offers recommendations on the safest automobiles.
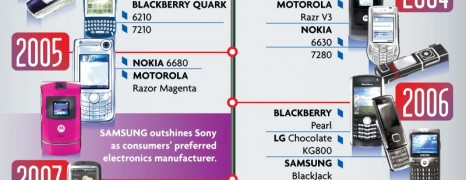
40 Years of Mobile Phones
visualized by: Computer Science Degree Hub
Have you lived in the bulky mobile phone era. At that times you would need a bag to carry your so called “handheld” device with dialing being the only option. But now things have radically changed. Our smartphones almost everything we need in hand. See how cell phones have evolved over the last 40 years.
Aggressive Driving Statistics
visualized by: BestAccountingDegrees.net
Getting uncontrollably aggressive, starting to cuss and coarse is quite common for most of us while driving. Behold! Road rage can turn to blight.
iOS Icon Size Guide
visualized by: Mobisoft Infotech
App developers’ exclusive! Are you building on iOS 7? Find here all the information regarding the various icon sizes required by iOS applications and design with confidence.
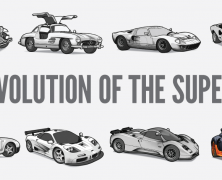
Supercar History
visualized by: Neo Mammalian Studios
Neo Mam studios show its excellence in creative design utilizing parallax technology to present the major machines, from the legends to the present beasts of the road. Eight of the most amazing supercars are waiting you to play with.
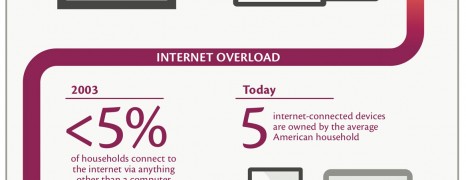
e-Commerce Transformation
visualized by: CORRA
This infographic clearly depicts the transformation of the e-Commerce conception throughout the last 10 years by contrasting the e-Shopping mindset between 2003 and today
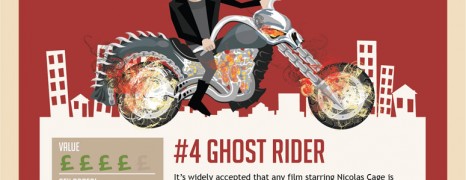
Hollywood Motorcycles
visualized by: Bikesure
Film makers love to use motorcycles in their movies, but some simply don’t do the two-wheeled motors justice. So which hollywood movies have featured memorable motorbikes, which would we rather forget?
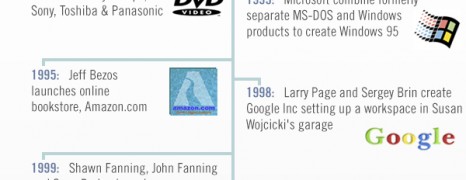
25 Years of Technology
visualized by: Insight UK
Technology runs faster than our eyes and it’s hard to pack 25 years of evolution in a “small box”. Guys from Insight UK with the opportunity of their 25th anniversary, handpicked 23 of the most striking milestones in tech history since 1988.
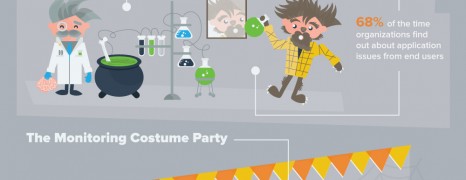
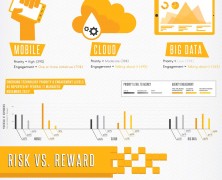
Application Monitoring Gap
visualized by: AppFirst.com
Some quick statistics about application performance monitoring and involved pitfalls in modern business environment with a touch of Halloween spirit.

Winter Proof your Car
visualized by: SpareFoot
Learn how to shield your car from the effects of severe winter conditions and foremost how to drive safely out in the cold.

HR and Cloud Computing
visualized by: Cezanne HR
Cloud computing has been up and running for more than 15 years. Don’t you think that HR departments can benefit from cloud technology ?

Choosing an it Support Company
visualized by: Webrevolve
Small businesses often outsource IT services as they cannot afford the cost of hiring IT professionals for their small to medium scaled IT needs. However, IT remains a vital factor for running and developing a business. Choosing the right IT support provider does not prerequisites advanced technical knowledge. This graphic lists 20 questions to help business owners screen the most competent IT support company.
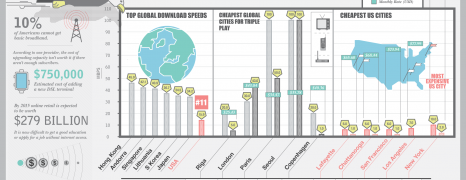
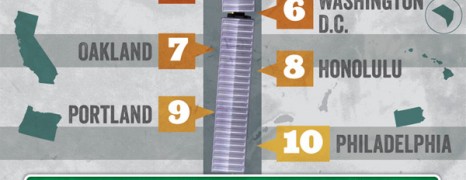
Slow American Internet
visualized by: nowsourcing.com
Would you expect that American citizens surf the internet at roughly 15.9 MB/s, about 30 MB/s slower than their Hong Kong peers? That puts USA at the 11th position in global internet speed rankings, even behind countries you wouldn’t think.
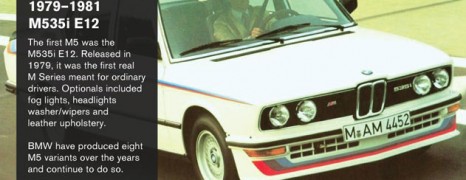
BMW M Series History
visualized by: Neo Mammalian Studios
With the launch of the brand new BMW M4 around the corner, it’s a good time to look back at the history of the legendary BMW M series. From the oldie M1 to the most recent X6 M E71, M Series has never stopped producing great cars in the last 35 years.
In celebration of BMW’s all-new M4 concept unveiling, we take a look a look at how the iconic performance division has evolved since it took the market by storm in 1978 with the flat nosed legend, the M1.
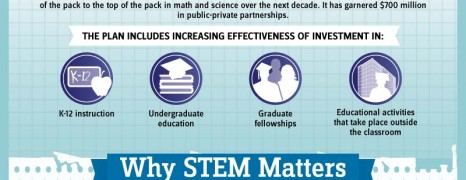
STEM Education USA
visualized by: Top Education Degrees
STEM stands for Science, Technology, Engineering and Mathematics and these 4 knowledge fields are the high hanging fruits for the education system in USA. According to this report native American labor falls far behind foreign job seekers in STEM skills. See what the improvement scheme involves.
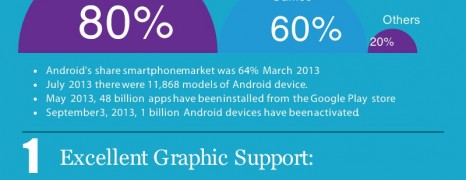
Android Framework Benefits
visualized by: PerceptionSystem.com
With this graphic, guys from Perception System present their views regarding the major benefits for app developers who are working on Android development framework.
eGov Security
visualized by: Symantec
Egov implementation is expanding year by year in developed countries. The question is how public sector’s IT departments can stem the increasing threat of cyber attacks, avoid the pain of data breach and defend their system’s security?
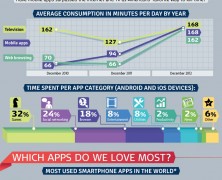
Apps Dominion
visualized by: bestcomputersciencedegrees.com
App usage is expanding to such extent that as of December 2012 it stacks up against tv watching in the US. Here you see statistics about apps’ market growth and penetration.
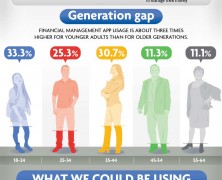
e-Wallet Adoption
visualized by: Master of Finance
Contrary to the explosion of personal finance management tools, both as mobile and desktop apps, Americans seem to fall behind in the adoption of e-Wallet practice. Generation gap is the rationale behind this situation.
")