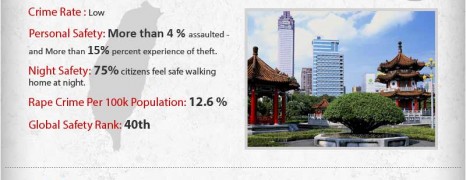
Japan and and Vietnam are deemed as the safest Asian countries for a woman travel alone, according to global safety rank records. Find 8 more safe places to visit in Asia and some tips to make your travelling safe and well.
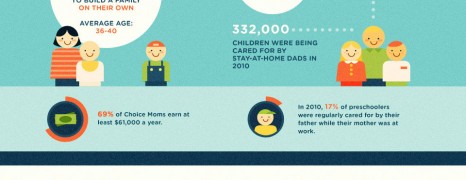
American Family Stories
visualized by: Ghergich&Co
Have a look at some historical statistics showing the vast change in marital state demographics across the US and in family structure conception.
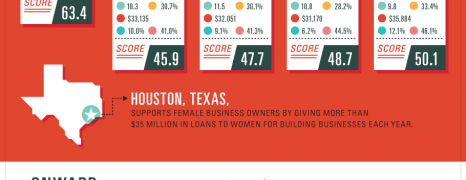
Women Entrepreneurship in USA
visualized by: INTUIT
Statistically, women outnumber men in higher education in USA. However, reality shows that they come upon snags when it comes to leadership or entrepreneurship. This infographic suggests the best cities accross the US that offer the best conditions to aspiring female entrepreneurs based on 5 key factors.

Back to 20s Gatsby Look
visualized by: Jordan Peck
A guide on how to get the look from the roaring 20’s, inspired by Baz Luhrmann’s new film, The Great Gatsby.
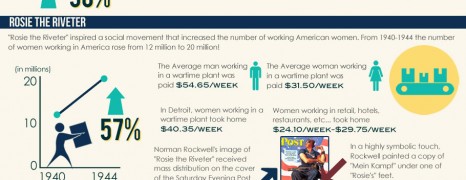
American Women Workers
visualized by: Jessie Fadayel
This infographic illustrates the changes occurred in women workforce during WWII and the present state of women in manufacturing. According to recent survey, a whopping gap of 600,000 skilled workers has been recorded, waiting to be filled by unemployed and qualified women.

When a Woman Loves a Man
visualized by: SeduzioneAttrazione.com
A boy exclusive infographic reversing the roles of the ever classic phrasing “When a man loves a woman”. Let’s see how a man can decipher a woman’s signals who’s in love with him.

Geek Love Affair
visualized by: Neo Mammalian Studios
Are you a geek in love thinking of getting yoked? “Will you marry me” is the typical phrase, but you likely need something more than classicality to get wired with your chosen. Find some humorous tips for making a really geeky wedding proposal without losing the romance a girl loves.
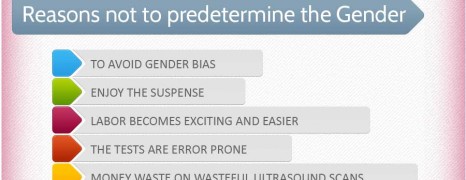
Pregnancy Gender Selection
visualized by: Graphs.net
Did you know that fresh veggies, fruits and alkaline rich foods can increase inclination to boy conception? Find more old wife tales along with a Chinese calendar that helps you in finding out the month to conceive a boy or a girl. Or simply leave it to the stork!
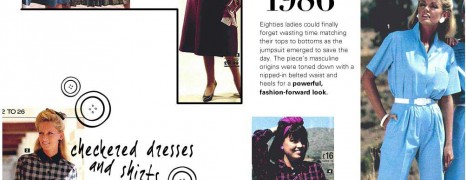
50 Years of Fashion
visualized by: Epiphany UK
Fashion addicts, take a journey to trends that are still leading fashion today. Simply Be presents a retrospective collection of the styles, forms, textures, patterns and colors that marked fashion industry and dominated catwalks from early 60’s to late 90’s.
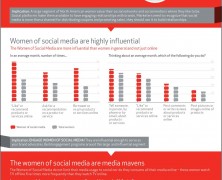
Digital Women
visualized by: WeberShandwick.com
Weber Shandwick in collaboration with KRC Research present some insights about women who are active and enthusiast about social media in an effort to spotlight their importance for marketers as a particularly engageable audience.
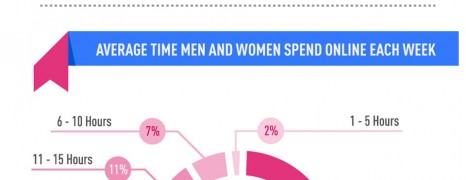
Internet Usage by Gender 2012
visualized by: BroadbandExpert.com
1029 adult respondents disclose their perception of internet usage as part of their day routine, how they prioritize various common activities and how they spend their time online.
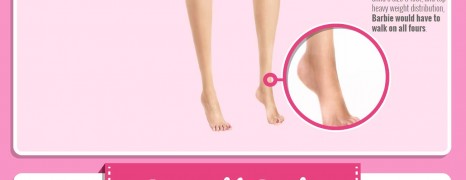
Impossible Barbie
visualized by: Rehabs.com
What are the chances for the average woman to attain the “Barbie-look” ? Almost zero, as it is plausibly impossible to hit all the measurements of such idealized proportions. Even models and anorexics miss here. See how far from reality is the barbie standard.
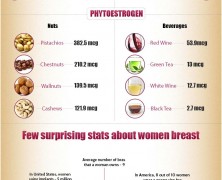
Boost Bust Naturally
visualized by: Graphs.net
Women who are wishing for a more curvy body shape with enhanced bust could try the natural way before visiting the “plastic” man. This graph presents how females can gain a better control of estrogen and testosterone and achieve breast enhancement by fine tuning their nutrition habits.
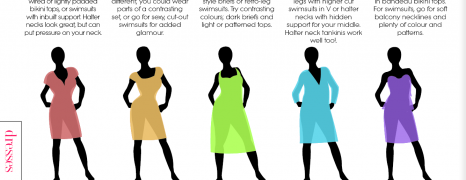
Body Shape Style Tips
visualized by: Allie Redmond
Nobody is perfect. Learn how to cover up imperfections and balance your body shape while accent your assets. A great infographic for women who are getting daunt of the thought to dress for their figure. Find some tips that will make you feel and look look great!
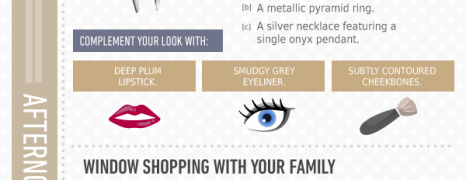
Jewelry Style Tips
visualized by: Presta
Girls exclusive infographic presenting smart tips on jewelry and make-up combinations that will make a “cat” look classy and tight on every occasion.
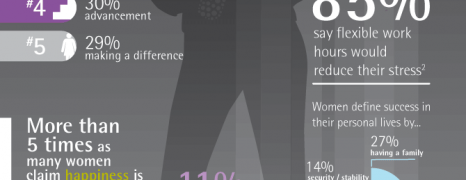
Happy Working Women
visualized by: Accenture
What defines success for women in the modern working environment and what motivates them more? Money or inward stability? Accenture worked on this and gives us an idea of what makes women happy.
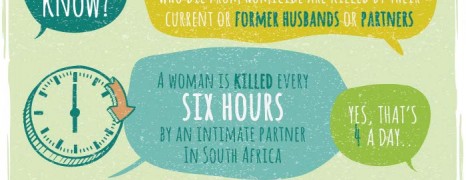
Violence Against Women Statistics
visualized by: Antonio Di Vico
Violence against women keeps blotting societies around the world without cultural, social or economic boundaries. United Nations report on the situation presenting shocking global statistics.

Chemistry of Love
visualized by: Mitchell Moffit & Gregory Brown
Common perception associates love with heart. But love is actually hitting our brain before making our heart beating like a hammer. Asap Science presents the biological background of love in an effort to explain the unexplained.
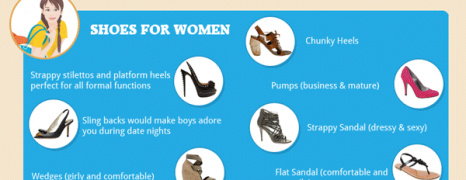
Shoe Styles for Women
visualized by: Diana
One pair of shoes will not fit for every occasion. This infographic by aquapillar.com helps you choose the right files for different occasions and highlights some facts from shoes’s history.
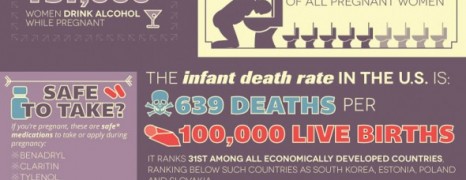
US Pregnancy Statistics
visualized by: nowsourcing.com
Are you expecting or are you planning to breed your offspring? Have a look at the common issues that US women encounter during and after their pregnancy.
")