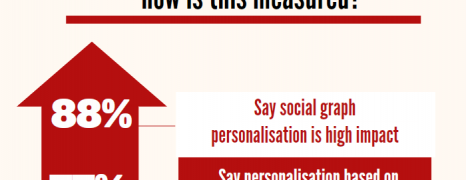
It’s not just to bring them in, it’s not just to make them act. You should offer personal experience and focus on building trust with your visitors. Adobe and E Consultency surveyed online marketers over their views about website personalization. Read the findings.
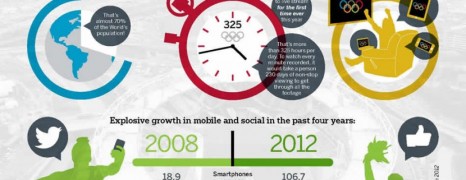
Online media and Olympics
visualized by: iProspect
Here is illustrated the social activity and mobile usage boom comparing statistics of 2 olympiad periods, one of Beijing 2008 and the present London 2012
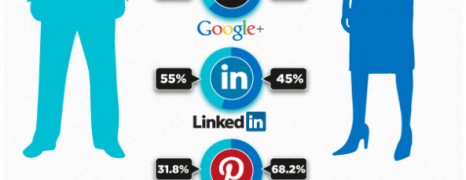
User Activity On Social Networks
visualized by: go-gulf.com
Basic comparison statistics for the high five of social networks: Linkedin, Twitter, Facebook, Google + and Pinterest.
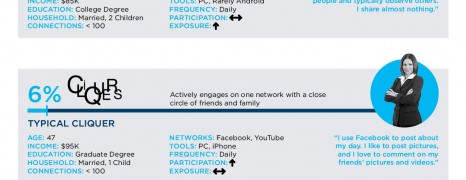
Social Media Personas
visualized by: AIMIA
A customer segmentation approach that suggests 6 social media usage personas based on behavioral drivers of Trust and Control.
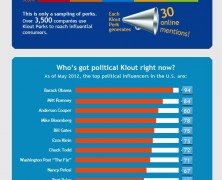
What is Klout?
visualized by: onlinedegrees.com
In a world where everything is measured and “deeply” analyzed it would be a miss the absence of social media influence measurement. Klout is a popular tool of this kind and this guide is good both for initiation and knowledge extension.
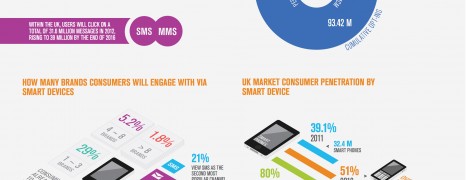
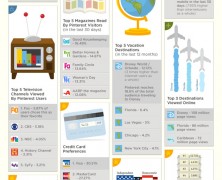
Consumers susceptible to Mobile Marketing
visualized by: Velti
People are getting more and more familiar with new mobile technologies and are ready and open to calls for action if they feel trust for a brand. Mobile channels are a top priority opportunity for online marketers. See the state of present and future mobile usage among users together with some behavioral analysis.
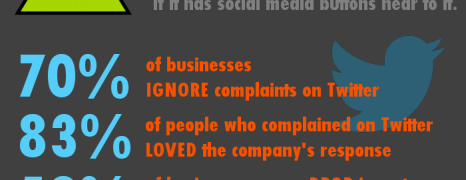
Twitter For Business 2012
visualized by: webpresence.tv
Well, ok – this is not the best infoGRAPHIC in terms of styling. But it worths to read these twitter stats from the business point of view.
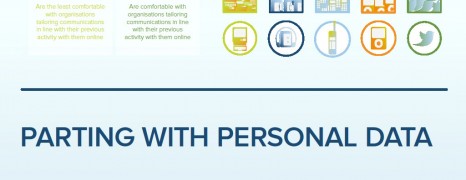
Personal Data And Trust
visualized by: Informatica
On this report you will learn that exposion of personal data is negotiable and has its trust-price depending on various factors. However middle aged users are less wiling to open their inner and evidently doubting about data integrity amongst businesses.
Very Pinteresting
visualized by: Modea
It’s the new kid on the block and it’s thriving! Pinterest is more than a female favourite social network. This report displays insights on the lifestyle anf behavior of P users
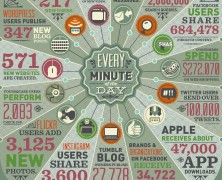
Data Never Sleeps
visualized by: Domo
How much data is generated every minute? Our digital activity creates terras of data on a daily basis and few of us realize this effect of magnification.
Social Media Insecurity
visualized by: TimeRAZOR
Are you a FOMO sufferer? Do you feel insecurity whenever you’re missing friends’updates, trends or online content on social media. Take the test and learn what FOMO is.
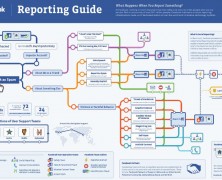
Facebook Reporting G...
visualized by: Facebook
Facebook manifests for the safety and security of users and rolls out this native chart to show us the competence of its spam/ abuse report system and the tools we have in our hands.
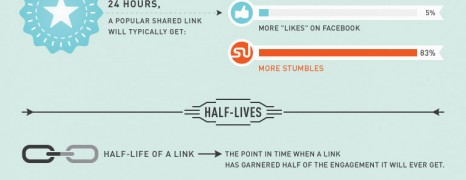
Stumbleupon Page Lifecycle
visualized by: Column Five
Stumbleupon strides in the US! It’s more than 3 times of the facebook average time that a user spends. Should you reconsider your social media strategy?
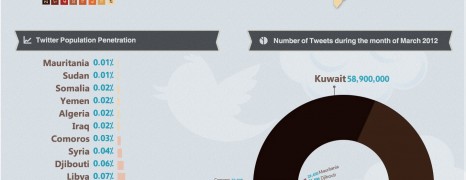
Twitter Users In the Arab World
visualized by: Lama Zaitoon
A quick review over the twitter expansion among users in the Arab countries.
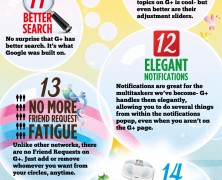
20 Reasons To Switch...
visualized by: Infographic Labs
If you are a facebook die hard fan this brief praise to Google plus network might be the end of your doubting Thomas attitude.
How People Spend The...
visualized by: go-gulf.com
A holistic overview on the time we dedicate for online activities, the most popular activities by frequency and time spent and the 10 most visited web properties.
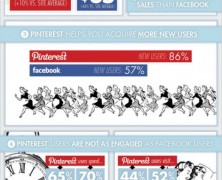
Pinterest Vs Faceboo...
visualized by: boticca.com
5 keynotes that you should consider when you evaluate facebook and pinterest for you online marketing success.
")