Workplace stress is reportedly connected with a number of employees’ mental health issues, resulting in notable cost for employers due to productivity or work hour loss. This infographic refers to the essentials of making office a better place to work and live.

Kill the Time Killers
visualized by: OfficeTime.net
According to an OfficeTime.net survey the average amount of dawdling time at work ranges between 1 and 2 hours per day. The best way to fight something is to know it. Learn which are the most common time killers, what type of time waster you are and how to start fixing this.
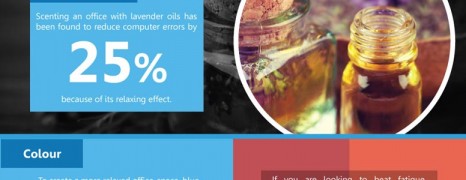
Inspiration at Work
visualized by: Jess3
Either being a business owner wearing all the hats or even a HR Manager animating the spirits in a big organization this nifty graph comes to remind you the significance of moving the cogs to the right direction and make the human engine tap into inspiration, creativity and productivity. It’s a win-win senario.
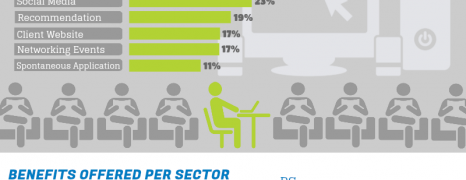
Job Seeker Motivation
visualized by: Found
This survey unveils the needs and wants of job seekers and presents how the motivation-perks stack up against public sector, financial services, commerce and industry.
")